.png?width=2167&height=417&name=Greenrock-Logo%20(1).png "Greenrock-Logo")

Share this
by Kevin Malone on Jan 11, 2024
The best investment strategy for 2023 in retrospect was buying and holding 7 stocks, Apple, Microsoft, Google, Amazon, Nvidia, Meta (Facebook), and Tesla. The best performing of those was Nvidia which started the year at $148, went as high as $505 and closed at $495. That is, by any historical standard, a remarkable price movement. The company as well has a very bright future, as there is no doubt AI will improve our lives for the better and Nvidia will be one of the beneficiaries. The question though is how and when will Nvidia monetize this opportunity. History tells us that the investment community vacillates between being too optimistic or too pessimistic about the future of any given stock, especially one like Nvidia. We think the market today is too optimistic on Nvidia.
Some Perspective
There is some interesting history that might be helpful in providing some perspective on why we are not jumping on the Nvidia bandwagon. The S&P 500 rose 55% in total during 1998 and 1999. That was the end of a long rise in stock prices that started in 1982. It was also the beginning of how technological advances would change our lives. There was remarkable optimism about how the cell phone and the internet would transform our lives. The poster child for this optimism was Microsoft which was one of 6 stocks that drove the market up for 1998 and 1999. Microsoft has made remarkable advances since that time, but the stock was grossly overpriced at the end of 1999. It took 15 years for Microsoft to get back to even after it declined like so many other stocks in the 2000‐2002 bear market. The company performed well as a business, advancing their products and services, but the overpriced nature of the stock at the end of 1999 caused it to be a terrible investment for 15 years. The stock was 45 at the end of 1999, went down to 20 and back to 45 at the end of 2014. Since 2014, the stock has risen from 45 to 370, a remarkable return.
Will this be the case with Nvidia of any of the other AI companies? While we hope not, it is hard to be optimistic. We have no doubt we will find remarkable progress in our daily lives because of AI, but our question today relates to the price investors pay for stocks that will be the beneficiaries. One perspective on this question comes to us from ARK, the technology investment firm we use for investments in the future. ARK bought Nvidia at $5 a share. During the time ARK owned the stock, Nvidia came close to bankruptcy twice. Last year when the stock got to $195, ARK sold. They did not hold on as it rose to $505. As you may have seen, ARK has been criticized for this sale. The reason ARK sold at $195 is because they have a rule that they sell a stock when they no longer see how they can get a 15% compounded annualized return over the next 5 years based on their assumptions. 5 years, all they had to do is wait 5 months and they would have seen their investment go up 2.5 times.
Now there is a misunderstanding about the research ARK produces. Many people think ARK does not have price discipline, but we disagree with that analysis. Actually, we think they have remarkable price discipline. It is true they pay high prices for stocks when looking at their current valuations as they purchase a stock. It is also true that tech investors get things wrong at times and when they do the losses can be big. But the sale of Nvidia is an example of their price discipline. They did not jump on the band wagon or attempt to ride the wave, they stuck to their discipline and sold.
2023: A Very Frustrating Year
So, 2023 will go down in our history as a very frustrating year. Chart 1 shows the returns of our domestic equity strategy against the S&P 500 index as well as the S&P 500 index without the 7 stocks that drove the market in 2023. We refer to this as the S&P 493. So, we have a number of observations.
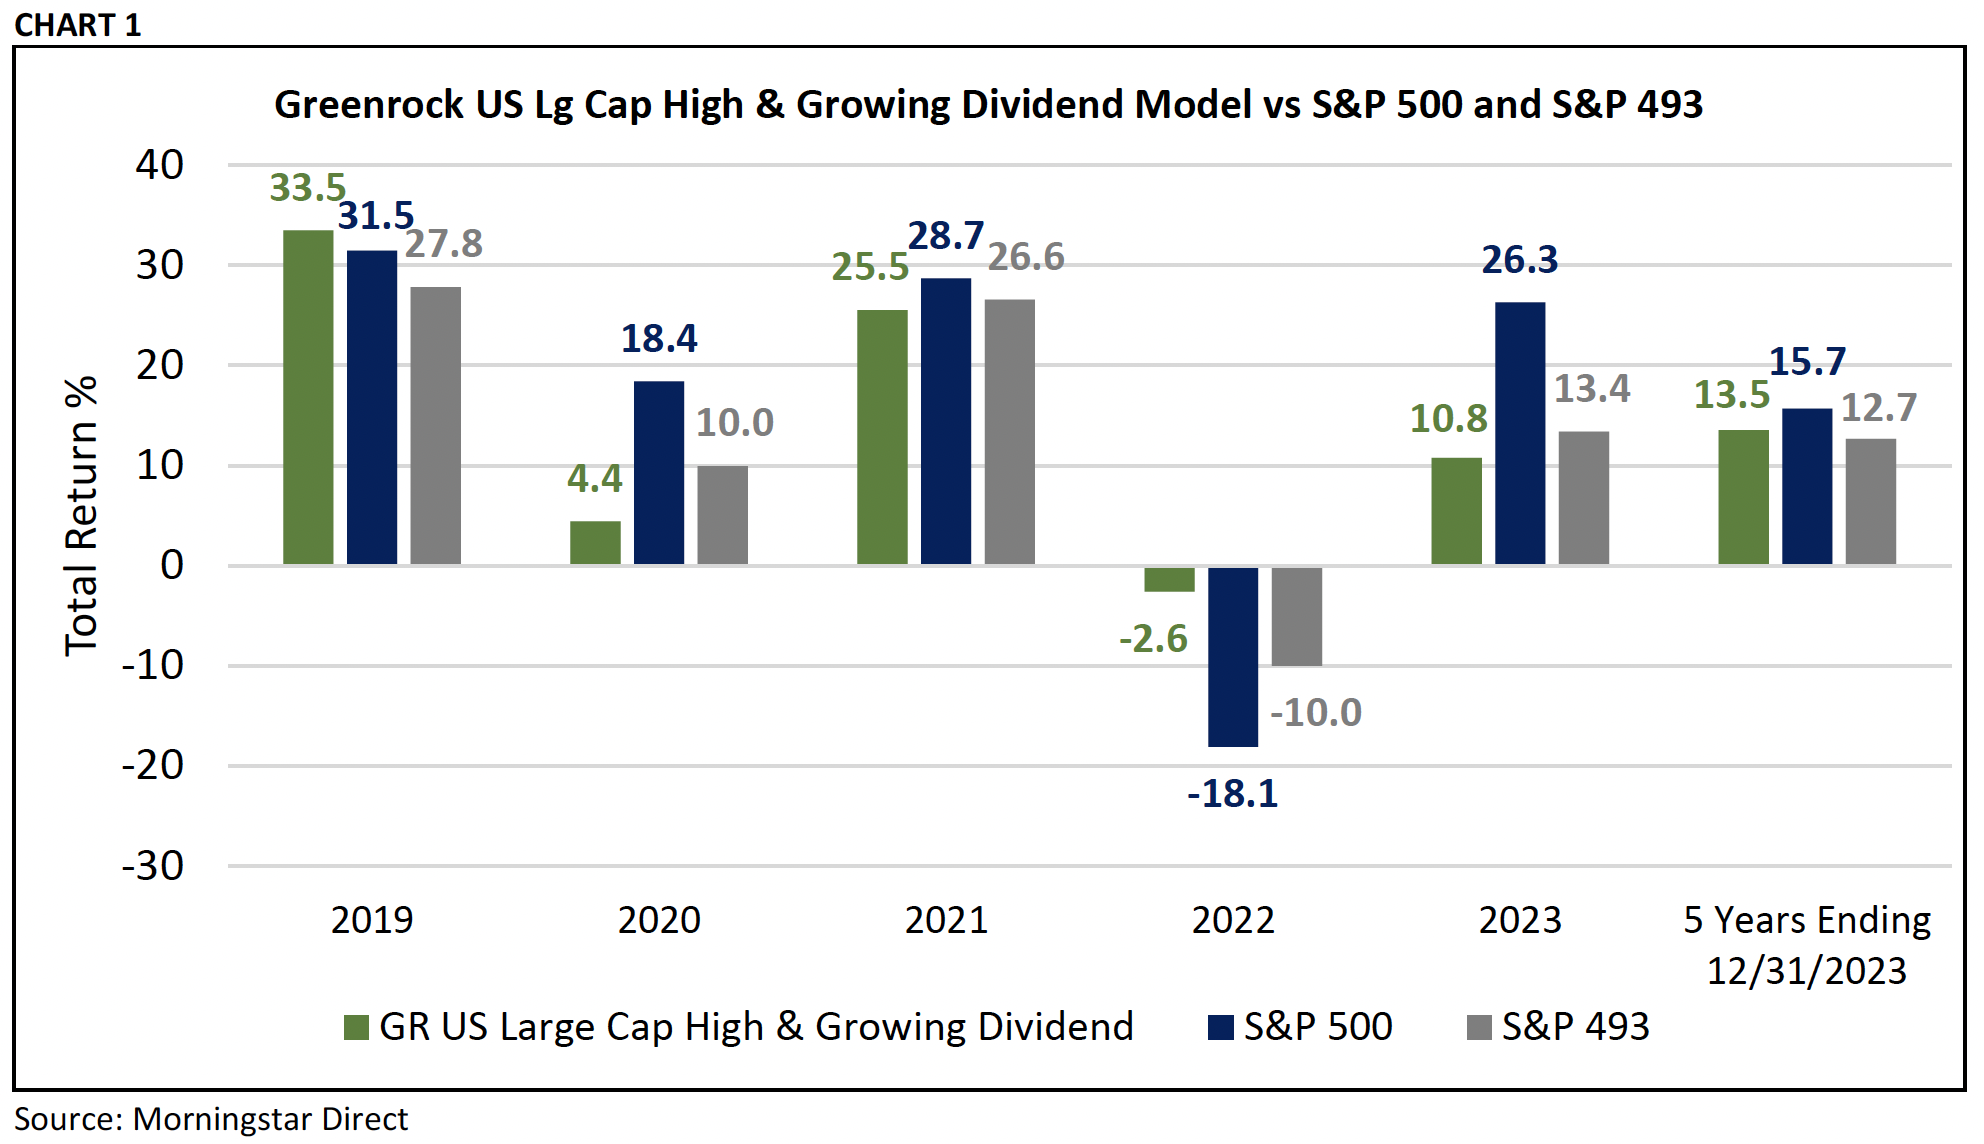
First, we did not keep pace with the S&P 500 index over the last 5 years. Honestly, anytime the index rises 15.7% annually over 5 years, our expectation is that we likely will not keep pace. We did, however, get a very attractive return over this period and slightly better than the S&P 493.
Second, we protected when the market declined in 2022. The index went down 18% while our domestic strategy went down 2%. As frustrating as 2023 was, 2022 was a year that saw our strategy protect the way we expect it to.
Third, we enter 2024 with a reasonably priced portfolio and a good dividend yield, 3.6%. This is in contrast with the index which is close to an all‐time high if you use the price to sales ratio as your measure. Do we wish our dividend yield was higher? Absolutely. But at some point, when we go through a correction, the dividend yield will protect us.
Our expectation of the next move in the domestic stock market is prices will go down. One analyst we follow closely, Felix Zulauf, is suggesting the market will decline by 25% to 30% in this next year. We do not make those types of predictions, but it is hard to believe that the stock market will rise, and even down 25% stocks would not be cheap. The best determination of future stock market returns is a measure of the current price relative to its history. When stocks are cheap, one can expect future returns to be attractive. Conversely, when stocks are expensive as they are now, future returns are low.
The stock market, however, does not move on logic in the short‐term, it moves on emotion. Last year is an example of that. The decline in stock prices that started in 2022 when the S&P 500 declined 18%, changed its movement last year because of the hysteria of 7 stocks. We think the down movement of the market that started in 2022 will continue in 2024.
The best source we found in evaluating future prospects for asset class returns is Research Affiliates. They publish daily their expected return for various asset classes over the next 10 years. Today their expected return from domestic large cap stocks is 4.2%. This is in contrast to the long‐term return from domestic stocks of 10% and the return in 2023 of 26%. So why so low? The simple answer is that domestic stocks are trading at very high prices relative to their history, and this is true if you use price to sales or price to earnings. The idea is actually quite simple, if stocks are trading at low prices, then future returns should be high; but if they are trading at high prices, then caution is suggested. Today, caution is suggested.
International and Small Cap
International and small cap tell a very different story.
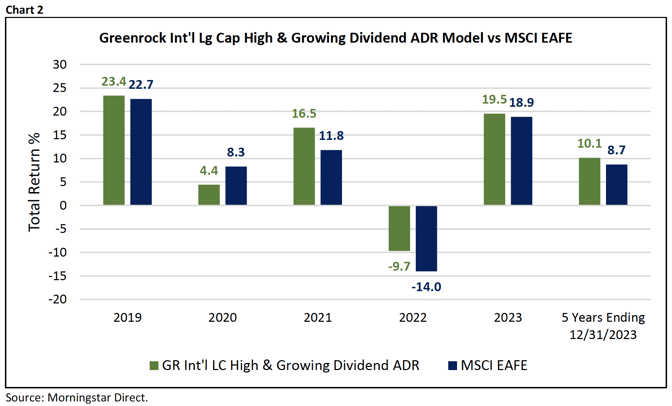
Chart 2 shows the returns over the last 5 years of our international manager, Janus Henderson, against the EAFE index. As you will see, the returns are attractive in 2023 with our portfolio up 19.5% and EAFE up 18.9%. Not quite the returns of the S&P 500, but attractive, nonetheless. You will also see the 5‐year return of our portfolio, 10.1%, while EAFE compounded at 8.7%. While the market did not give us the opportunity of reasonable returns, our strategy and our manager were able to find them.
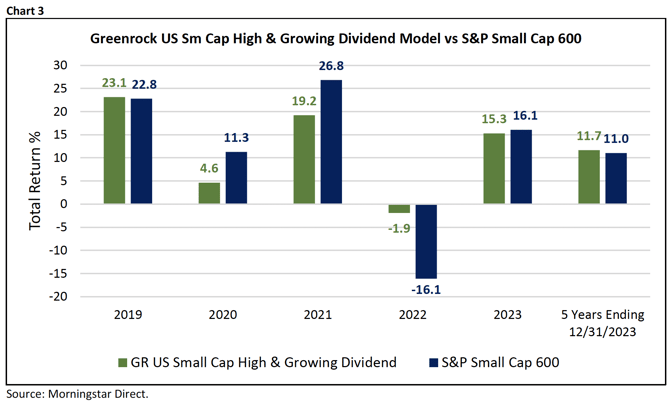
Chart 3 shows the returns over the last 5 years of our domestic small cap manager, North Star, against the small cap domestic index. The story is similar to the International portfolio. Good returns over the last 5 years, although not quite the returns of domestic large cap.
Both of these asset classes have potentially higher projected returns over the next 5‐10 years when compared to domestic large cap. Research Affiliates projects a return over the next 10 years of 9.5% for International and 7.9% for domestic small cap, while only 4.2% for domestic large cap.
Now it is important to note that these are projections and based on future returns historically when past returns were those we have experienced. It makes sense projected returns are higher for International and Domestic Small Cap because the last 5 years these asset classes have underperformed Domestic Large Cap. The precision of these projections is inexact at best. There is no system to provide precise projections of future returns. So, this should be taken as an estimate, simply said, it should be understood to project higher returns from underperforming asset classes.
So, How Do We Take Advantage of This Analysis?
The answer to this question needs to be understood in light of our equity investment strategy. If we were using indexes, then we would naturally overweight the underperforming asset classes of the past and underweight the overperforming asset classes. But, as you know, we do not use indexes, we use growing dividend strategies. The expectation we have with our High and Growing Dividend Strategy is that we may go through periods where the index outperforms our dividend portfolio, like the last 5 years in domestic large cap. This has happened historically, and we expect that to be the case prospectively. We also expect to get real protection in declining market periods, like we did in 2022 when the index declined by 18% and declined by only 2%. We saw this in the decade of the 2000s and 2010s. Chart 4 shows the performance of our dividend strategy and the S&P 500 index.
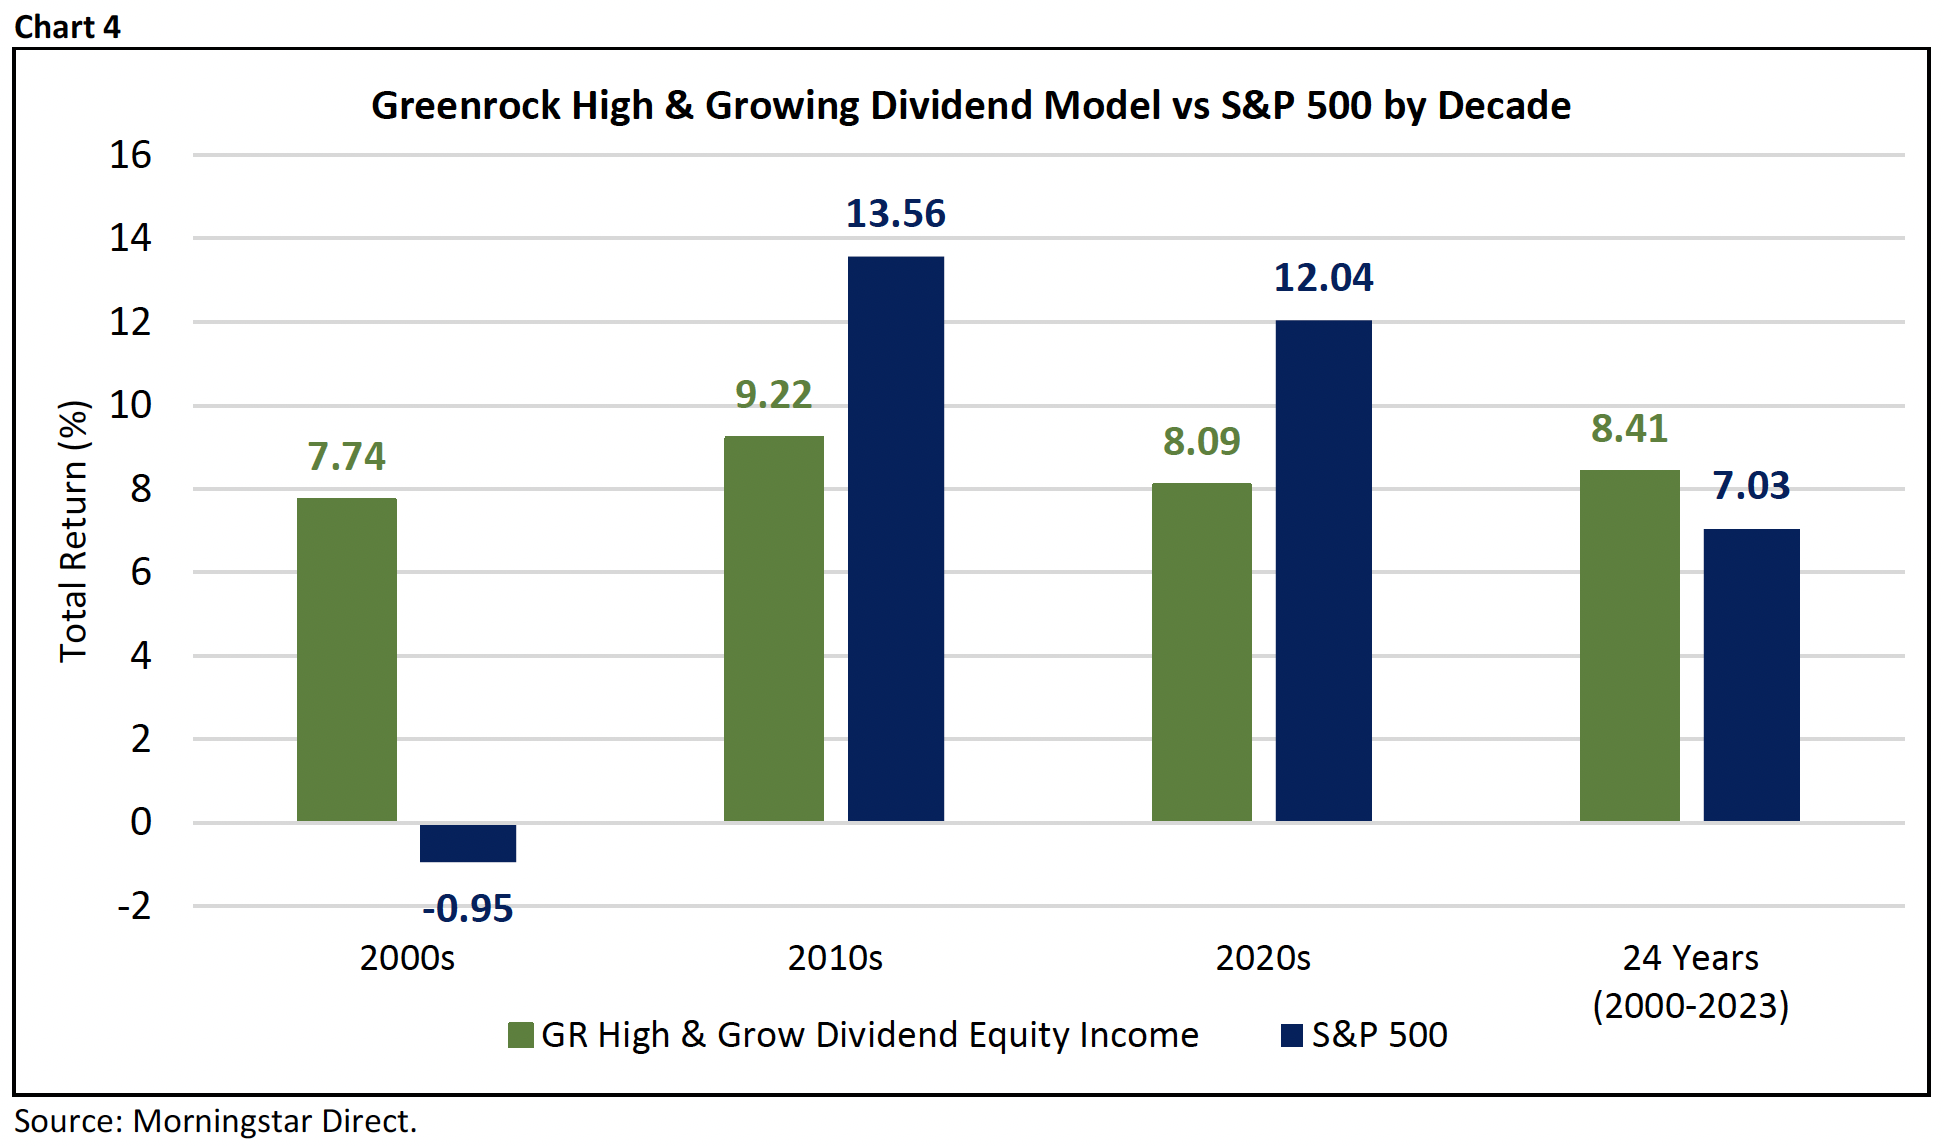
As you can see, our Growing Dividend Strategy produced reasonable returns in both decades, a higher return over the 24 years, and while not on the chart, did so with lower volatility. That is our projection over the next period of decline. If Felix is right and we see the domestic stock market lower next summer, we expect our dividend portfolio to give us real protection. If the stock market declines by 25%, what will be our return? That is impossible to answer, but our expectation would be very low single digits.
So, the direct answer to the question of how we take advantage of this potential decline is that we are taking care of it. Over the last 5 years, would we have liked to annualize our portfolios at 15.7% just like the S&P 500? Absolutely! But our return of 13.5% was well very strong and if we can follow that with real protection like we got in 2022, then we will be fine.
Bonds
As you know, we have not used bonds in our portfolios for almost 6 years. Rather we have used the portfolios of 3EDGE Asset Management. This has served us well. In 2022 when rates rose, the 10‐Year US Treasury declined by 13% while the 3EDGE Conservative Portfolio declined by 2.9%. Now, it is true if rates decline from where they are now, the 10‐Year will recover some of that loss, and it is highly unlikely the 3EDGE Conservative Portfolio will keep pace. It is more likely they will be up slightly. But even if this happens, and the return of our portfolio and the 10‐Year are identical over time, our portfolio will have achieved that return with much lower volatility. One of the reasons anyone invests in bonds is low volatility, and down 13% is not low volatility.
Now it is worth mentioning that we are interviewing bond managers again for the first time in 6 years.
Oddly enough, our first in‐office meeting with a bond manager was about 10 weeks ago when the rate on the 10‐Year peaked. We are in the camp with those who believe when the stock market declines, the Fed will take action and lower rates. If this is right, we will not invest in bonds any time soon. There is the possibility that we are wrong and rates rise rather than fall, and the yield on the 10‐Year becomes very attractive. If that is what happens, you can expect us to be back seriously looking at bonds.
Alternatives
We have used 3EDGE as a portfolio that both reduces the volatility of equity portfolios as well as provides reasonable long‐term returns. The Conservative Portfolio is a direct substitute for bonds while the Total Return Portfolio is a substitute for a mix of stocks and bonds. The standard deviation of the 10‐ Year is 4 while the Conservative shows a standard deviation of 4.4. The standard deviation of the S&P 500 is 15 while the standard deviation of the Total Return Portfolio is 7.25. The way the math works when looking for a substitute for a balanced portfolio is the Total Return Portfolio has a vol similar to 70% bonds and 30% stocks. This can give you a way to think about allocation for any individual client. We are happy to discuss specific allocations for groups of clients or any individual client.
Every client needs a 3EDGE account because you cannot use bonds. When bonds were a viable asset class, it was easy to determine allocations for any client between stocks and bonds. We admit it takes a little more work when using 3EDGE. We think the best way to do this is to use the data above. We can help with this or lend perspective if it would help.
What Else Looks Attractive?
The short answer is not much. This is the reality of investing. It would be nice if we could find investment bargains all the time, but we cannot. Market movements provide opportunities and sometimes several of them all at once. Now is a time for caution, a time for preservation. The time will come when there are opportunities, perhaps next summer if Felix is right on how the stock market moves. If we can wind up with 100 cent dollars or close to 100 cent dollars when the index gives us 70 cent dollars, we will find some opportunities. We have found some remarkable opportunities in the past when we went through corrections, and if we see a correction this year, we expect there will be some bargains as well. Patience and keeping our eyes wide open are the two traits we will be using and time will tell what we find.
Illiquid Investments
Periods like the one we see ahead are times when liquidity carries a price burden. As positive as we are about achieving client investment goals, we also see the potential for much higher returns from illiquid investments. Now as you are aware, we like short duration illiquid investments. We have three whose holding periods will be between 3.5 and 4.5 years. Would we like it shorter? Absolutely. But we also like sunny days with temperatures in the 70s.
These are the illiquid investment opportunities that we find very attractive today. We have three requirements when investing in illiquid investments, and they are as follows:
1. The investments need to have current cash flow. We like this because it means the management does not need to revolutionize the business to make it an attractive investment. They simply need to manage it and grow it in a conservative manner.
2. The maturity needs to be reasonably short, under 5 years. We have used this criteria for over a decade and have been successful because of it. During that time, because of market conditions some investments have been extended, from 3 years to 4 years or 4 years to 5 years. We have never experienced an extension similar to what was seen in non‐traded REITs, and that is what we want to avoid. But conditions can present themselves where an extension from 3.5 years to 4.5 years may arise. We have lived with that in the past and we need to recognize it may happen again.
3. The investment opportunity needs to be a simple business opportunity. We like simple stories because while businesses can go through difficult times, we want to anticipate those possible difficult times up front as best we can. If we can, then our experience of extending maturity will be reasonable.
These are the three investments:
Oak Institutional
This firm lends capital to businesses and projects for short periods, generally 2 years. They can give an approval of loans in 30 days, separating them from the banks which can take 6 months or longer. The investment plans to turn the portfolio twice, thus a 3.5 to 4.5 year investment time horizon. Investors will get 6% cash flow from day and an expected total return of 15%.
Carter Funds
This firm buys 30‐year‐old garden apartment complexes. They renovate the public grounds and pool areas to make them look new. They also renovate 20% of the units with new bathrooms and new kitchens. Their properties are in the southeast part of the U.S. and go out to Texas. Renters can get an unfinished apartment or one with a new bathroom or kitchen or both. When leases expire, they find some renters will want some upgrades. They have a very efficient way of renovating units and can do so inside one week. The IRR on renovations is over 60%.
They plan to put the portfolio on the market to sell in 3 years. The appeal they have to a new buyer is the buyer can finish the renovations and thus increase their cash flow.
Our investors will receive 6.7% during the life of the project and an expected return of 15%.
Groma
This firm buys apartments buildings, mainly 3 flats. They have found this small unit count multifamily market to be very inefficient, and overlooked by institutional investors. They renovate the units to one of three standards depending on where the property is located. In addition, they bring technology into the management of these buildings, significantly improving expense ratios and net operating income. They project property level IRR's in the high teens to low 20's.
The small unit apartment complex business is a mom-and-pop business - similar to the Single Family Rental (SFR) market a decade ago. What Groma does is to build scale to make it a mature business, thus increasing its value. Investors can expect to receive cash flow starting in year 3 of 4% to 5%. When the project is completed, the expected projected return to investors is expected to be 15%+.
Bitcoin
Perhaps the most controversial of our recommendations, Bitcoin will become a replacement currency for many nations and a store of value that increases as its acceptance and use grows. While we would acknowledge there is a small chance Bitcoin will not survive, we believe it will succeed. The reason Bitcoin can survive is that the major countries in the world are hoping for a devaluation of their currency over time. In thinking about the future of the Dollar, the Euro and the Yen, it is hard to see how any of them get stronger. In fact, each government would like to see devaluation of their currency over time so that they are repaying their debt with lower valuations.
Bitcoin will be the beneficiary of this phenomenon. We believe the total valuation of Bitcoin will grow to equal the total valuation of gold. Today the total value of gold is approximately $10 Trillion, while the total value of Bitcoin is less than $500 billion. So, Gold is approximately 20 times as valuable today as Bitcoin. The value of Bitcoin would need to have a price over $900,000 per coin to approximate the total value of gold.
Now there is no investment opportunity today that is more controversial today than Bitcoin. There are analysts who think Bitcoin is fool’s play and others who think everyone is underestimating its value. Ark owns Bitcoin and believes it will be over $1 million in 5 years. We take their estimate seriously because they are investing in Bitcoin, not just commenting on it.
We believe the price will be higher in 5 years and we also believe this needs to be a long‐term hold for anyone who buys Bitcoin. Our specific recommendation is it should be 2.5% of one’s portfolio at cost. While we agree Bitcoin is too volatile for some clients, we do think it is an asset all clients should consider.
2024?
So, this is our analysis and thoughts for now. This is the longest newsletter we have ever written for two reasons. First, the concentrated returns of 2023 in domestic stocks is remarkably dangerous. We saw a similar phenomenon after 1999 when the stock market fell by 49% and had a negative return for a decade. Second, when stocks are generally overpriced, like they are now, surprises become part of normal. Many investors are followers, they buy what just worked. While it is a suicidal investment strategy, it can move the market even higher. 2024 is an election year as you know, and our country could not be more divided on our preference for who should be the President starting next year. Overpriced stocks in an election year will mean volatility will be high. Expect it and know you will continue to hear from us as we weather the next storm.
Disclosures
Greenrock Research is a registered investment advisor.
The information provided herein is intended for financial professionals and represents the opinions of Greenrock Research management and is not intended to be a forecast of future events, a guarantee of future results, nor investment advice.
Past performance is not necessarily indicative of future returns and the value of investments and the income derived from them can go down as well as up.
Our views expressed herein are subject to change and should not be construed as a recommendation or offer to buy or sell any security or invest in any sector and are not designed or intended as basis or determination for making any investment decision for any security or sector.
There is no guarantee that the objectives stated herein will be achieved.
All factual information contained herein is derived from sources which Greenrock believes are reliable, but Greenrock cannot guarantee complete accuracy.
Any charts, graphics or formulas contained in this piece are only for the purpose of illustration.
The performance data shown represents past performance, which is not a guarantee of future results. Investment returns and principal value will fluctuate, so that investors' shares, when sold, may be worth more or less than their original cost. Current performance may be lower or higher than the performance data cited.