.png?width=2167&height=417&name=Greenrock-Logo%20(1).png "Greenrock-Logo")

Share this
by Kevin Malone on Mar 31, 2019
TheWhat happened in 2018?
What will 2019 bring us?
What will work long‐term?
2018
Let’s start with 2017. To understand 2018, at least the first part, a review of 2017 will help. The S&P 500 was up 21.8% in 2017 and every month experienced positive returns. Volatility was at historic lows as the biggest intramonth decline was less than 3%. There was anticipation of corporate and individual tax cuts as well as the loosening of regulations. Investors were excited about the Trump Agenda especially with republicans controlling both houses of congress. The FAANG stocks led the way and consumer confidence was high. There was talk of 4% GDP growth after the tax cuts were passed and that growth was expected to continue for a very long time. The message was our economy was strong, and the new president was ushering in a growth era.
2018 continued that mantra as the tax cuts were passed and Q2, 2018 saw 4% GDP growth. Q3 came in over 3% and there was more talk of 3%‐4% GDP growth continuing for a very long period. Both the stock market and the bond market reflected higher GDP growth, as stock prices and bond yields both rose. The 10 Year U.S.
Treasury peaked at a 3.24% yield on November 8th and the S&P 500 peaked up 9.2% for the year on September 20th. Talk of continued 3%‐4% GDP growth was abundant, and there were suggestions that we were just getting started.
WHAT A DIFFERENCE A QUARTER MAKES!
By the end of the year the 10 Year dropped to a 2.69% yield as talk of an economic slowdown replaced the euphoria of high growth. The Fed set a target GDP growth of 2.3% for 2019. The S&P 500 went from a high of 2,930 on September 20th to a low of 2,351 on December 24th. December, in particular, was dramatic as the S&P 500 ended down 9.03% in spite of a huge rally the last 5 trading days of the year on very low volume. 2018 left us with a taste of two markets, the one we hoped for and the one that was built on reality.
SO, WHAT HAPPENS IN A 2% GDP GROWTH ENVIRONMENT?
We wrote about this last January, so it is interesting that the topic comes back up 12 months later. GDP growth in this country from 1947‐1999 was 3.5%, while GDP from 2000‐2018 was 2%. The first period of 3.5% GDP growth was driven by two distinct economic phenomena, the rebuilding of America after World War II and the combination of the coming of age of the baby boomers, emergence of China and the advances of technology in the 1980s and 1990s. This country had huge economic catalysts during these two periods. The U.S. government started the rebuilding of America after World War II with policies like the Highway Act and the GI Bill which was followed by corporate spending and expansion. The baby boomers as well as China needed everything from toasters to cars, banking services to health care as we saw the expansion in the 1980s and the 1990s. In addition, the advances of technology helped push growth to levels never imagined.
Today the catalysts are hard to find. Demographics in our country, Europe, China and Japan point to a slowdown in growth, not a boom time. The S&P 500 started in 1958 and a look at the returns from 1958‐1999, the boom time, as compared to 2000‐2018, the low growth period, may give us some insights into what we can expect over the next decade. From 1958‐1999 the S&P 500 compounded at 12.9% while from 2000‐2018 it compounded at 4.9%.
The returns of the last 19 years are almost assuredly our future. Without big catalysts that drive growth and with our demographic make‐up, it seems nearly impossible to believe we will return to the grand old days of double‐digit returns. When we study what large firms are projecting for equity returns over the next decade, we find some proof of our theory. Vanguard is suggesting less than 2% while Black Rock and Goldman Sachs are suggesting 5%, just what the market has produced over the last 19 years. Bob Schiller is projecting 2% while Jeremy Siegel suggests 5%. This, however, may not be dire. Inflation is very low as well, and if the indices give us 5% in a 2% inflationary period, you can still help clients achieve their investment goals. If this is our environment, we feel confident our growing dividend strategies will outperform just as they have for the last 19 years.
We would love to see higher GDP growth, but prudence and our fiduciary responsibility requires we deal with our observation of reality, not our hope for the most optimistic outcome.
WHAT ARE OUR OBSERVATIONS FOR 2019 AND BEYOND?
- The volatility of 2018 is here to stay.
We likely will not see the low volatility of 2017 for a very long time, perhaps not for decades. Markets hate uncertainty, and we live in a very uncertain world. So, expect markets to react to perceived good news or bad news in a dramatic fashion. One month you will see a rising market because of a jobs report or growth report, and the next month you will see a falling market because of the shape of the yield curve or a report on China’s slowdown. Expect this, it will be the reality of our markets. We will need to keep you focused on the long‐term and you will need to keep your clients similarly focused. - The Fed target of 2.3% GDP growth for 2019 is likely very accurate.
Expect our country to be in the 2% GDP growth environment for years. But, also expect volatility in GDP growth over the period. Over the last 19 years we have experienced 2% GDP growth, but we have seen annual numbers of 4% and negative. It is normal for GDP growth to have some volatility, so expect to see that volatility in the future. - Non‐U.S. stocks will outperform U.S. stocks for a long time.
The dollar has been very strong, but there are cycles to the of dollar strength followed by dollar weakness. Investors have been lulled into thinking that you only need the domestic market. The S&P 500 has outperformed EAFE in 5 out of the last 6 years, yet historically there is cyclicality to the over and under performance of both indices. Chart 1 shows the history of the over and under performance of domestic and international stocks. Will this trend start in 2019? Well no one can answer that, but you do not want to be on wrong side of this chart when it reverses. - The cash flow from your growing dividend strategy will be higher over the next decade than the appreciation of the underlying stocks.
Our current equity portfolio has a 3.7% current dividend yield. Our underlying managers believe dividend growth will continue to be in the 8% area. We did some analysis that assumes dividend growth is just 6% over the next decade. If that were the case, and it should be noted that it could be lower than 6%, the compounded cash flow over that decade would be 5.17% with the dividend yield in the 10th year of 6.63%. That 5.17% compounded cash flow is higher than any estimate we can find of total return for the general domestic stock market. This should not seem optimistic to you. Over the last 19 years the S&P 500 has compounded at 4.9% while our dividend portfolios have compounded at 7.6%. - The traditional bond market is still a broken asset class.
The yield on the 10‐Year U.S. Treasury on 12/31/2018 was 2.69%. Until that gets to 5%, you will need to be less dependent on fixed income that you have been traditionally. This is why all clients need a Liquid Alternatives manager. December was an example of why these managers are so important. For the month, the S&P 500 was down 9.03% while the 3EDGE Total Return and Conservative portfolios were down 1.30% and 0.30% respectively. - Non‐liquid investments will perform very well when compared to traditional, liquid portfolios.
We have portfolios with high cash‐flow, 5%‐6%, and very favorable terms in needed infrastructure investments with very low minimums and very reasonable fees. These need to be reviewed for clients as part of an overall investment strategy.
Chart 1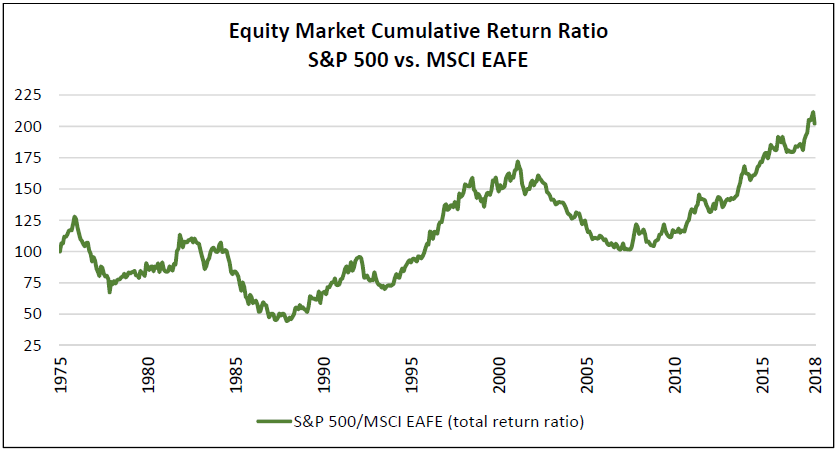 Source: Morningstar Direct
NEW GREENROCK PORTFOLIOS FOR 2019
1. We have a retained a new sub‐advisor, Forefront Analytics. The firm is headed by Chris Geczy, a professor in the Wharton School at the University of Pennsylvania. Their team will manage diversified ETF portfolios with risk‐on/risk‐off characteristics. These portfolios will be complete portfolios with global investments in equities, fixed income, real estate and commodities. Forefront has been managing similar portfolios for large corporations, family offices and state funds, and this is their first offering in the RIA space. We especially like them because their risk, diversification and investment theories mirror what we use in our portfolios.
2. We have a new twist on fixed income. We have retained Gannett, Welch and Kotler to manage for us a diversified corporate bond portfolio that is intended to be held until the portfolio of bonds mature. GWK is a specialist in the BBB/BB space, and these portfolios currently yield 5%.
3. We have had an MLP portfolio for 3 years. This portfolio today yields 7.3% and has had double digit dividend growth over the last 3 years. We have not had an entry point into this portfolio for 2.5 years because the price of oil has been so high. With the current decline, this portfolio can be an interesting addition to portfolios.
4. We continue to like the idea of having a stake of portfolios in India. We do believe emerging markets will outperform developed markets over the next decade, but we would like a better entry point. It may be that 2019 gives us that opportunity.
GLOBAL DEBT CRISIS
You are likely reading about a potential global debt crisis. In this country corporate debt has risen dramatically over the last decade. For example, BBB debt was $700 Billion in 2018 and today it is $3 trillion. You have seen the negotiations with Puerto Rico debt, and Greece and Italy seemed prime for some reconfiguring of their debt. We believe this talk will continue for some time, likely decades. It is likely true that if pressed some of the BBB rated corporations would find it difficult to repay their debt today, and the same can be said for Greece and Italy. But the reality is none of these entities are being pushed. So, we think it is possible there could be a debt crisis here or abroad, but the more likely event is everything gets kicked down the road. We want you to know we have considered this, and if the worst were to happen, we feel confident our portfolios are well positioned.