.png?width=2167&height=417&name=Greenrock-Logo%20(1).png "Greenrock-Logo")

Share this
by Kevin Malone on Mar 31, 2020
The 2020s a New Decade
Let’s start with a review of 2019
2019 was the most surprising year in decades to most analysts. While it is true there were some analysts who suggested at this time last year that we would have positive returns in 2019, most analysts were cautious. The consensus was that while we may have positive returns, up 31% surprised everyone.
2019 was also the best example of why market timing is fools play. It is fine to have ranges of equity exposure that you will use at periods of overvalued and undervalued stock prices, but it is critical to remember history has taught us that getting out of the stock market too early because you think valuations are too high makes it nearly impossible to get back in. Chart 1 shows the returns of the various indices for 2019.
Chart 1 Source: Morningstar Direct
Our performance for 2019 is detailed in Chart 2. As you will see our domestic equity portfolio marginally beat the S&P 500. Our total return was 26.6% and was bought about because we had international and small cap in our portfolio. We are not complaining about 26.6%, one gets very few of those years.
Chart 2 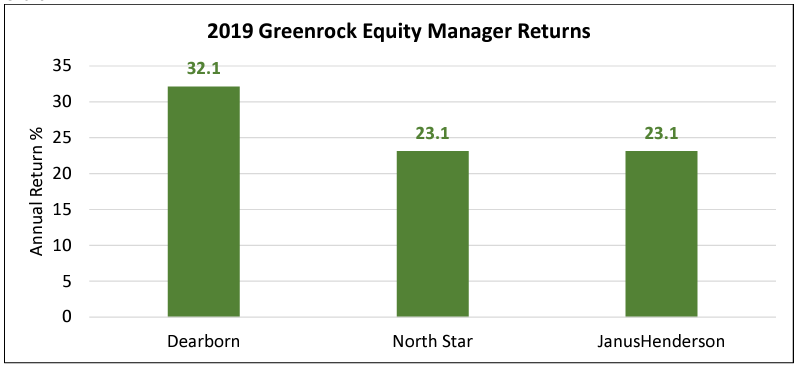 Source: Greenrock Research
So now predict 2020
It will come as no surprise to anyone that we are cautious about 2020. This time last year we thought domestic large cap stocks were overvalued relative to domestic small cap and international. It is only logical for us to hold the same caution today. The rise in stocks came more in PE expansion than earnings growth. PEs grew by approximately 25% in 2019, according to 361 Capital. There is an old rule that suggests if you add the PE of the market and inflation the total should equal 20 when stocks are fully priced. Today the total comes to slightly over 20, so this brings comfort to those who believe the market will continue to rise. Assuming inflation is approximately where it was last year, just under 2%, with a P/E of 18 all of the future price increases need to come from earnings, unless we are headed back to the crazy P/E levels of the late 1990s. This says caution. We can certainly have positive earnings in 2020 and thus a positive return from stocks, but it is not likely to be a double-digit return year.
What about the decade of the 2020s?
Let’s look at history and see what has happened. We will start with the 1980s.
The 1980s: The Japan Decade
Chart 3 shows the returns of asset classes in the 1980s. Japan outperformed everything by a large margin. While EAFE had good performance, you need to remember that Japan was about half of that index. The U.S. had good returns, but not the returns of Japan.
Chart 3 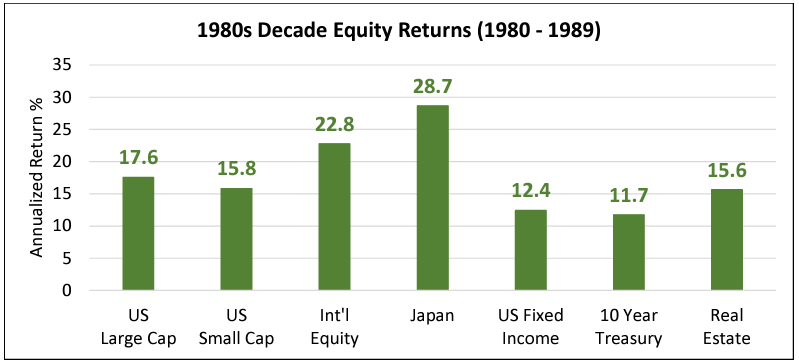 Source: Morningstar Direct
The 1990s: The U.S. Tech Decade
Chart 4 shows the returns of asset classes in the 1990s. Japan, the star of the 1980s actually had negative returns. Emerging Markets had double digit returns, but not close to the 18% annualized returns of the S&P 500. Growth outperformed value, but you will remember that the outperformance of growth came in large part during the last two years of the 1990s when the top 12 and then the top 5 stocks in the index provided the entire return. The decade ended with stock valuations at the highest levels since the depression.
Chart 4  Source: Morningstar Direct
The 2000s: The Emergence of Emerging Markets
Chart 5 shows the returns of the 2000s. Just as Japan had experienced negative returns in the 1990s after beating everything in the 1980s, the U.S. had negative returns a decade after outperforming every other region. China was principally responsible for the 2000s returns in Emerging Markets, but many emerging market economies performed very well.
Chart 5 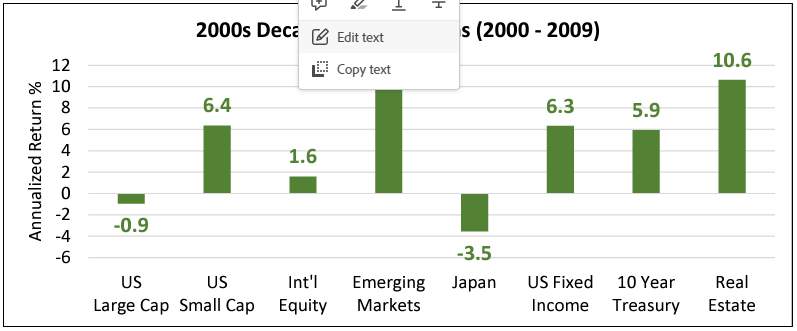 Source: Morningstar Direct
The 2010s: The U.S. Safe Haven
Not only did 2019 provide great returns to those who held domestic large cap stocks, the decade of the 2010s was the decade of the U.S. Chart 6 shows returns for equity assets.
Chart 6 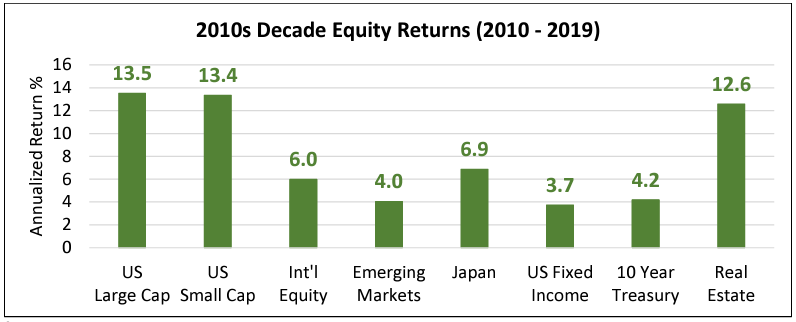 Source: Morningstar Direct
Ten years ago, we lived in a much different world. We were less than one year up from the bottom of stock prices after the global financial crisis. Yields on preferred stocks and high yield bonds exceeded 12% and there was little optimism to be found. While all stock markets were trading at bargain prices, investors were leery of the future. Had one suggested that by investing in the S&P 500, one would compound assets at 13% over the decade of the 2010s, there would have been few believers.
Today, stock prices are high, yet investors are comfortable investing at these levels. History has shown us this pattern many times. Investors are comfortable when the recent history of returns is high. Conversely, investors are cautious when recent returns have been poor or negative. We believe success is dependent on developing instincts that are polar opposites. You should buy when stock prices are cheap and be cautious when stock prices are dear. Today stock prices are dear, so caution is warranted.
The 2020s
Japan led in the 1980s and then the U.S. in the 1990s, Emerging Markets in the 2000s and then the U.S. in the 2010s. So, the question for the 2020s is ‘Will this pattern of one region outperforming and then underperforming continue’? Or ‘Will be see dominance by the U.S. continue in the 2020s’? History tells us valuation will be the dominant theme to answer these questions.
Vanguard is the largest index provider of U.S. securities. Actually, over the last 5 years they have accounted for over two-thirds of the net investments in U.S. equity mutual funds. Annually, they make predictions of future returns, just like many firms do. We will use them as an example of how we see the future for two reasons. First, if their future returns projections were a low number, it could theoretically impact their business. Investors might reason if Vanguard thinks they will achieve low returns, they might find another firm predicting higher returns. The second reason has to do with the consensus of the research we review. Their prediction is very similar to other firms we respect. Certainly, we have seen predictions with higher returns, but we have also seen predictions with very low returns, even negative returns. Vanguard’s prediction is right in the middle. Just an editorial note, having followed Vanguard for decades, our first concern is not a real one. We think they are an honorable firm whose philosophy is to provide the most thoughtful advice they can, and they would not be influenced by business implications. We believe Vanguard would only report what their research shows without any considerations on their future business.
Vanguard projects the S&P 500 will compound at 3.8% over the next 10 years. The make-up of the returns starts with the dividend of the index which at year end was 1.9%. If we assume some level of dividend growth throughout the decade, the appreciation part of the total return cannot be 1.9%. The appreciation return needs to be less than 1.9% annually. It is more likely to be 1.5% annualized, perhaps less.
Why so low?
There are two factors that we believe weigh heavily into the Vanguard projection. During the 2010s, the dollar was king; it was the default currency of the world. So, will that continue? Perhaps, but it is unlikely to get better. In other words, there may be some developments coming that would have investors take safe harbor in another currency, a trend we have not seen in over a decade but certainly have seen in the past. The second part is valuation. U.S. stocks are pricey compared to the rest of the world. Now some analysts will point to the P/E’s being below the crazy levels of the late 1990s, and we agree. But the quality of earnings over the last decade has not been encouraging. We have seen high levels of stock buy-back schemes but not much top line growth. Some would suggest we are on the cusp of a top line growth period. Perhaps, but there are no signs of that, and there are factors that would suggest the opposite. Our demographics are not encouraging, and the developed world is in the same place. Emerging Markets have fabulous demographics, but are they strong enough to lead the entire world? We think not. India and China will likely provide interesting returns in the coming decade, likely significantly higher than Vanguard is suggesting we will get domestically. Oxford Economics has a report out that suggests the ten fastest growing cities in the world in the next decade are all in India. But both India and China have issues. China contributed to our dominance in the 2010s but has announced they are moving toward a consumption economy. This does not bode well for our stocks. So, we will look closely at our currency and at valuations, we think they are the concerns of Vanguard and our concerns as well.
The Returns will not be Linear
One certainty we have is that Vanguard’s prediction of a 3.8% return over the next decade is that it will not be 3.8% per year. Expect volatility. There is a lot of discussion today on the coming correction. When will it start? Will it be 40%, 50% or just 25%? Last year is an example of why trying to predict this timing is difficult at best. If you look at the corrections of the past 20 years, 2000-2002 and 2008, what we find interesting is we knew the causes prior to the correction. Everyone knew stock prices were overvalued in 1999, and everyone knew there was too much leverage in financial institutions and the mortgage portfolios they put together in 2007. What we did not know was when the correction might start. Stocks were overvalued in 1998 and there was too much leverage in our financial system in 2006, yet 1999 and 2007 offered great returns.
If Vanguard is right and the next decade provides annual returns of 3.8%, one implication of that analysis is we will have a correction, maybe more than one correction. But how and when are impossible to predict. From 1969-1981 our equity markets had three corrections of 25% in round numbers. That was a quite different experience from the large corrections of 2000-2002 and 2008. So, our advice is to expect some corrections. They have been part of our investment landscape over time and will be part of our future. In addition, they offer great opportunities because all assets and asset classes do not decline in a linear fashion. Some asset classes will decline much more than the general market and will create unusual buying opportunities for those who are patient. We have taken advantage of these in the past and believe we can do so in the future.
Factors that could cause a correction
We think there are three factors to watch: inflation, the BBB bond market, and the possibility of an event that impacts global stability. We will be studying inflation and the potential issues with the amount of BBB rated bonds we find today. These are likely to be the main causes of the next correction. No one is projecting inflation today, and there do not seem to be any signs of inflation; but that should not give us comfort. Inflation would be devastating to the global economy. The same is true for the bond market. Today 50% of the Barclays Aggregate Bond Index is corporate bonds rated BBB. Even a slight slip in a company’s financial position could have that firm slip into BB. If this happened, it could trigger ratings reductions that could devastate both the bond and equity markets. Steve Blumenthal of CMG thinks we will see unusual opportunities in High Yield sometime in the next few years. He is talking about double digit yields and should this happen we would want to have cash available to invest with Steve in those portfolios.
Our third concern is what economists call an exogenous variable, one that comes from outside the economic model. In other words, an event that we did not anticipate yet could have a dramatic impact on stock prices. Tariffs and the potential of a trade war were discussed as an issue in 2019, an unwarranted concern at this point. Today trouble in the Middle East is occupying our papers and our airways. Hopefully this too will be an unwarranted worry. The nature of an exogenous variable is such that we could not predict it. We are in an election year and it is easy to find comfort in our favorite outcome and simultaneously easy to find concern in a different outcome. So, we mention this not knowing what to look for, only to point out that we may not know today all of the causes of a potential correction.
Why Dividend Strategies are Even More Important Today?
The easy answer is math. Today our global high and growing dividend portfolio has a 3.7% yield. We believe dividend growth will not be as robust in the next decade as it has been. Historically, we have achieved dividend growth in the 8% range. If we just project dividend increases of 0.25% per year over the next decade, the cash flow from our portfolios will be 4.87%. In other words, if we get no appreciation over the next decade our return will be 4.87%. We think no appreciation is unlikely because the final dividend yield using this projection will be slightly over 6%. So, it is possible 10 years from now that our portfolios will yield 6%, but it is more likely they will yield less because the price of our portfolios will rise. Dividend strategies have historically well outperformed indices when the return on indices was low. In addition, dividend strategies have generally provided clients with good protection during corrections, whether those corrections were 25% or 40%. So, cash flow is likely to be the king over the next decade.
What about Bonds?
This is a much easier question. The return on bond portfolios starts with the current yield on that portfolio. We then adjust the total return based on whether rates rise or fall from that level. Let’s look at the 10 Year U.S. Treasury. Chart 7 shows the returns on the 10 Year for each decade since the 1910s, along with the starting yield for the decade. This is why we use the 10 Year as a proxy, it has a very long history. The outlier in this chart is the decade of the 1980s. Interest rates peeked in the 1980s when the 10 Year reached a yield of over 15%. So, double digit returns were not surprising. The yield on the 10 year at the end of 2019 was 1.9%. The total returns of the 1990s, 2000s and 2010s declined from the 1980’s as interest rates declined. So, what is likely to happen when we start with a yield of 1.9%? It is certainly possible for rates to go lower. There are $11 trillion of bonds with negative interest rates around the world today. Now it may seem impossible for the U.S. to get to negative rates, but it is possible, unlikely but possible. Ben Bernanke, former Fed Chair, just suggested the Fed develop a policy and not announce the details for using negative rates. But even as unlikely as that seems today, if it were to happen the return of the 10 Year would be higher than 1.9%. The decade of the 2010s saw the total return of the 10 Year to be 3.76%. Even with negative rates 10 years from now, the return of the 10 Year is likely not to be higher than it was in the last decade. So, expect very low returns from your bond portfolios.
Chart 7 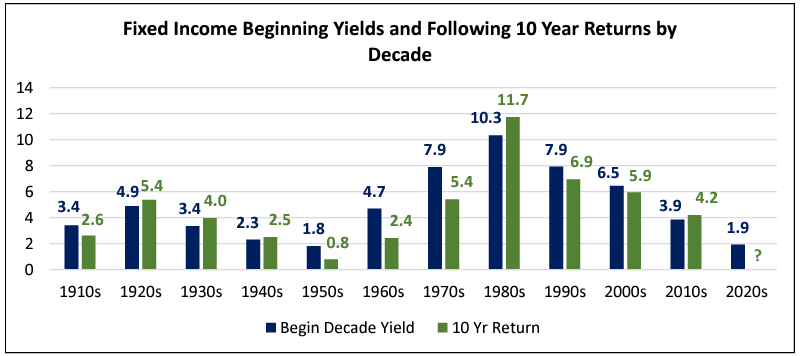 Source: St. Louis Federal Reserve (FRED), Morningstar Direct
How Do we Get Higher Returns?
This will be easy as long as we are willing to take the long view and be patient. We have several rules for living through what will likely be a difficult decade for our domestic markets.
- Expect volatility and corrections. They are a part of our history and will be a part of our future. The two asset classes that worry us the most as overvalued today are High Yield and domestic growth stocks. If you own them, take profits. Caution suggests reducing risk in portfolios today is the best course.
- Take advantage of opportunities when they present themselves. The high yield bond market could present an opportunity to invest with double digit yields as Steve Blumenthal is suggesting. This and other opportunities will allow for the potential for very high returns. But they are likely to come in a period of uncertainty just as they have in the past.
- Growth stocks are overpriced today, yet we may see a time during the decade when they are reasonably priced. This will likely be after a period of negative returns and be associated with an uncertain future.
- Use High and Growing Dividends as the core equity strategy. Our portfolios yield 3.7% today and will have interesting dividend growth. Equity investors will achieve most of their return from dividends not appreciation in their equity portfolios over the next decade. These portfolios start with a much higher yield and will be a safe haven for those looking to reduce risk.
- If we are right and the 2020s is not another decade of outperformance by the domestic securities, you will need to be open to investments in other parts of the world. This has certainly worked in the past, and we think it will work in this new decade.
- Think about illiquid investments for all of your clients. We have several opportunities in investments with positive cash flow of 6% that could achieve low double-digit total returns. These will well outperform liquid markets, and the reality is there are virtually no clients who need all of their funds liquid.
- Remember that your goal is achieving reasonable returns over decades for your clients, not attempting to compete with years like 2019. Investing can look like a genius and fool business; you want to be a long-term genius.
- If you own growth stocks or high yield bonds, we need to have a discussion.