.png?width=2167&height=417&name=Greenrock-Logo%20(1).png "Greenrock-Logo")

Share this
by Kevin Malone on Mar 31, 2021
2021: What Will the New Year Bring?
We will provide perspectives on market valuations and investment solutions for 2021, but before we do, we need to look back at 2020.
2020: Would You Like to Do that Again?
Nobody is signing up for another 2020! We have had great years and bad years, but 2020 redefined a bad year for all of us. Very few of us had ever thought about living in a pandemic, but we all know what that is like now. Here is a short list of what happened last year:
- The President is impeached but not removed from office.
- Covid-19 spread throughout our country, the first pandemic in over 100 years.
- By the close of the year, 350,000 Americans would be dead from the pandemic and 4 million would contract the disease.
- We endured the worst economic crisis since the Depression.
- The stock market went through the quickest decline of -33.8% in history (2/19/20 – 3/23/20: 33 days).
- The Fed took interest rates to zero, the first time since the Depression.
- The 10-Year U.S. Treasury traded under 0.50% for the first time in history, after it traded under 1% for the first time in history.
- Stimulus checks and forgivable loans were given to individuals and corporations, twice.
- Corporations learned how to do business without employees coming to the office.
- We had the most divided election in modern history with the highest turnout in history.
This list, and you may add to it, would be enough to cause real volatility in our investment markets and our society if this happened over a decade.
In spite of all of this, the S&P 500 rose 18% for the year and bond portfolios were up over 7%. No one would have believed our markets would achieve above average returns at the end of Q1 or the first part of Q2. Analysts in a simplistic way referred to this recovery as a K-shaped recovery, the rich recovered well because stock prices rose and the poor saw their lives get worse. Unemployment numbers were double digit but ended the year over 7%. The hospitality business was devastated as restaurants and bars were forced to close. Airlines and hotels saw declines we never imagined. So, all of this feels a little unbalanced and makes us wonder what will happen in 2021.
2021: Be Careful!
That is our advice, we are no place close to normal. We have a long way to go as vaccines have just started to be delivered, but cities are still fundamentally closed. The vigor and the life that we normally associate with cities does not exist. Will it come back quickly and to what extent? Will the vaccine be as effective as anticipated? Will schools be fully open? Will offices be open or will we continue to work from home? What about travel? After 9/11, it took three years for the airlines to recover, how long will it take this time? So, this list of unanswered questions makes for dramatic uncertainty, and our markets hate uncertainty. If you add to this list how the Biden administration will react to the need for more stimulus and more help for the unemployed, it makes you wonder if sitting out this year in a bunker is the right approach.
We are optimistic, not in a Pollyanna way but rather in a manner that starts with the resiliency of our people and the creativity of our corporations. As a country we have always risen to our challenges, and while today we feel like a divided country, we will solve this.
Year-End Bond Analysis
Are bond prices reasonable? We wrote in July that the decline in interest rates broke the bond market as a viable investment tool for almost all your clients. We are happy to send you that piece to review upon request. The logic is simple, the return from bonds comes from the coupon and the appreciation or depreciation of principal based on whether rates rise or fall. The chart below shows what happened to bond returns after the Depression, the last time the Fed took rates down dramatically.
Chart 1
The annualized return of the 10-Year Treasury over this 40-year time was 2.41% annualized. If you were counseling people during this period, how many of your clients do you think would have been happy with a gross return of 2.41? Our guess is none. Now we know that many of you are thinking good managers can do better than the 10-Year, and we agree. The Barclays Aggregate Bond Index started in 1975 and achieved an annualized return of 7.31% for the 45 years ending 2019. During the same period, the 10-Year return was 6.84%, or 0.47% behind the Aggregate. So, add 0.47% to 2.41% and you will have a total return of 2.88% for 40 years, gross of fees. To get that return, a client would have needed to pay a management fee. Even if you could have achieved a return of 2.88% over 40 years, your clients would have not achieved their investment return needs. Remember, that would have been a gross fee before management fee and your fee.
So, let’s look at the next ten years. Chart 1 shows the beginning yield for each of the four decades. They range from 2.12% to 3.82%. On December 31, 2020, the yield on the 10-Year was 0.91% and that is why we are calling the bond market broken. True enough many governments around the world have negative rates and our 10-Year could go negative, but with a starting yield of 0.91%, those rates would have to go really negative to achieve the investment returns your clients will need to reach their investment goals.
The expected return of the 10-Year is easy to determine over the next decade if we only knew the yield ten years from now, but we do not. We can, however, look at Chart 1 to see what might happen. If you look at the relationship between the yield of the 10-Year at the beginning and ending of each decade, you can see whether the total return was higher or lower than the coupon at the beginning of the decade. In the 1930s, the yield started at 3.45% and went to 2.48% at the end of the decade. The total return was 3.96%, higher than the starting yield. Using the same logic for each decade, you can see that in those decades when rates declined, total returns were higher than the beginning yield of that decade. That was the case for the 1930s and the 1940s. But rates rose in the 1950s from 2.12% to 3.82%, and the total return of the 1950s was a mere 0.78%. So, you can decide for yourself, will rates be higher or lower in ten years? We have no ability to predict where rates will be in a decade, but we would say that if you are starting with a yield of less than 1%, it is a bad bet to suggest you will get a decent return or that rates will be lower ten years from now. We have solutions to this which we will get to after we look at the stock market.
Year-End Stock Market Analysis
The S&P 500 achieved a return of 18.4%, amazing given the year we had. That is in round numbers 80% higher than the long-term average of the index. So, if stocks rose so well, what could be wrong? The answer is stocks did not rise 18%, a few rose over 50%, but most stocks were up only slightly. Chart 2 shows the attribution of the top five stocks of the S&P 500 plus Netflix.
Chart 2 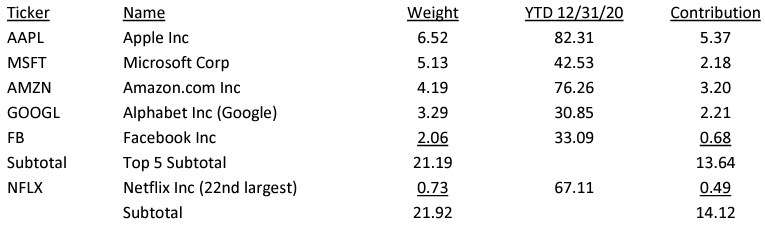
The contribution to the total return of 18.4% of the S&P 500 from those six stocks was 14.12%, which means the other 494 stocks were up 4.28% for the year. The return of an equally weighted portfolio of these six stocks was up 55.4%. So, the story of return for 2020 was one of concentration. The S&P growth sector rose over 33% driven by these six stocks while the S&P value sector rose just 1.36%.
There are two principles that need to be addressed when you have a year like 2020 where a few stocks did really well, and the general market did not follow. The first is these periods do not last long; they can show dramatic returns, but their life is reasonably short. Second, mean reversion means reasonably priced stocks will shine for a long period. The last time we saw this type of concentration was 1998 and 1999. The top 12 stocks provided the total return in 1998 and the top six in 1999. The annualized returns of the index were 28.54% in 1998 and 21.04% in 1999. So just like in 2020, returns can be very attractive when concentration is responsible for returns, the problem is what follows. For the decade of the 2000s, following these dramatic returns from concentration in 1998 and 1999, the S&P 500 averaged negative returns for the next decade, declining 0.95% annually for the decade.
Now this concern of low or negative returns over the next decade may not be a worry if stocks are inexpensive today, so let’s look at whether stocks are cheap or dear. Warren Buffett has a simple rule: if you can buy stocks when the value of the index is at a discount to the level of GDP of the country, you are getting a bargain. Conversely, when stocks trade at a premium, it is not a good time to buy an index. We know in 1999 stocks were overpriced trading at a 56% premium to GDP. At the end of last year, stocks traded at a valuation of 1.72 times GDP or a 72% premium. This is the highest premium ever recorded.
The other way we like to look at whether stocks are cheap or dear is by looking at price to sales. True you can use earnings, but earnings can be manipulated and sales cannot. Chart 3 shows the S&P 500 price to sales over time.
Chart 3 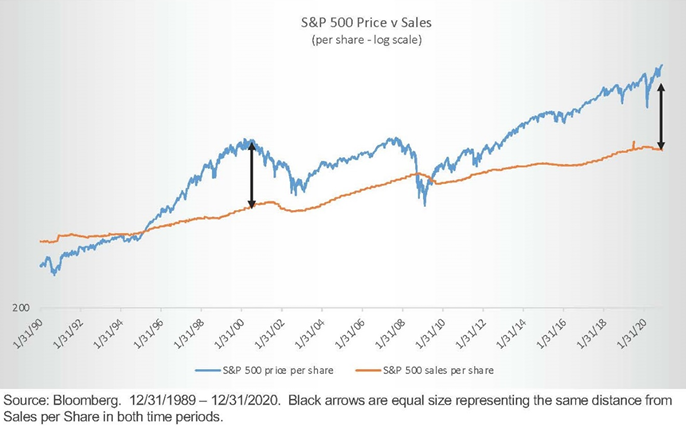
As you can see the price to sales ratio in 1999 confirms stocks were overpriced, but not as overpriced as they were at the end of 2020. Does this mean we are entering a decade when the index will have negative returns? There are thoughtful sources for the answer to this question. Rob Arnott founded Research Affiliates to provide thoughtful answers to this question and more. We respect his work, and like it especially because it is updated every day. He is not someone who prognosticates at the beginning of the year and then never refers to those predictions again. Research Affiliates prediction for the return of the S&P 500 over the next decade is -0.20%. Now that does not mean this will come to pass? The direct answer is no, but this analysis combined with Warren Buffett’s GDP measurement and the price to sales data suggests caution.
All of this seems reasonable, but we have one caution: overpriced stocks can stay overpriced for longer than we think. Every time this phenomenon of concentration occurs, index investors suggest this time is different. The Nifty Fifty of the 1960s market, the concentration of the tech bubble and the disruptive technology bubble today all have or had proponents that assured investors that this time would be different. The one guarantee you have is that it will not be different! Many of the Nifty Fifty stocks are no longer with us, they filed for bankruptcy. The top six tech stocks that gave you the whole return of 1999 have not fared well over 20 years later. Five of them are still below their 1999 price, only Microsoft is higher and it took over 15 years to get to break even. So, we do not know if this is 1999 or earlier in that decade, but we do know that the FAAAM stocks and Netflix are screaming at you to be cautious.
2021 Investment Solutions
So, if both stocks and bonds are overpriced, where do we look for return? We have three ideas that can round out a portfolio and will provide investment returns that meet your client’s investment return needs.
Equities
The core of equity portfolios we recommend is the strategy we have been using for over 20 years, High and Growing Dividends. This portfolio has three managers: domestic large cap, international and domestic small cap in order to give exposure to the breadth of the market. The portfolio focuses on dividend level and dividend growth. Currently, the portfolio has a yield of 3.75% and expected growth of dividends of 8%. The performance history is insightful for how we think the 2020s will unfold. Over the last two decades ending in 2019, the 2000s and the 2010s, the S&P 500 compounded at 6.1% while our dividend portfolio compounded at 8.5%. Those two decades when the S&P 500 compounded at -0.95% for the 2000s and 13.5% for the 2010s, our dividend portfolio compounded at 7.7% and 9.2%. So, the returns of our dividend strategy are similar whether returns were high like the 2010s or negative like the 2000s. The reason for this is the returns come mainly from dividends paid combined with increases in dividends. We think the relative performance of the 2000s between the S&P 500 down 0.95% and our dividend strategy up 7.7% is exactly what investors will experience in the decade of the 2020s.
The stocks that contributed 14% of the 18% return of the S&P 500 all have something in common: they are all disruptive technology stocks. They have all replaced a category or created a new category. Amazon changed the way we shop, Netflix changed the way we watch movies and television, Apple brought us a computer in our pocket, Facebook created a new social communication system, Google allowed us to search for anything, and Microsoft allowed us to store data in ways inconceivable not long ago. These stocks have driven returns for the last decade. The problem we have with them today is their collective prices. There are other disruptive technology stocks that have yet to be recognized, and these are the stocks that need to be a part of all equity portfolios. Ark is a New York investment firm started in 2014 to specialize in the development of portfolios that participate in disruptive technology companies. They have disrupted the investment management business by analyzing which companies will lead five years from now. Most investment firms focus on the year or even quarterly earnings, but Ark ignores those early periods. We have a concentrated portfolio that represents their best ideas, is available for very low minimums and is less expensive than their ETFs. Almost everyone’s client needs to have a portion of their equities in this Ark concentrated portfolio.
Our recommended allocation to these two strategies for the Core client is 75%-85% to High and Growing Dividends and 15%-25% to Disruptive Technology, but we have one caution on entry point. The Ark portfolios have had remarkable performance and we think they will continue to do so, but they have been and will continue to be more volatile than the market. So, our current recommendation is to allocate only 33% of the final allocation at this time. If your final allocation should be 15% of equities, put in 5% now.
Bonds
As we stated above, the expected return of bonds will not solve the investment return needs of your clients. Historically, bonds were added to an all-equity portfolio for three reasons: they reduced the volatility of an allequity portfolio, had low correlation to equities and increased the income. Today they accomplish the first two: reduce volatility and have low correlation, but they no longer increase income. Because the rates are so low, their expected return is worse than the 1940s when the 10-Year return was 0.78%. So, what do you do?
Alternative Investment ETF Portfolios
You need to separate the need for volatility reduction from the need for income. Below we will get to income, but our focus here is finding investments that will not increase the volatility of portfolios. We have been using diversified ETF portfolios to reduce the volatility of equities for 20 years, and they have done a terrific job of doing so. They are ETF portfolios that use bonds, stocks, commodities, gold and REITS in diversified manner but also have risk on/risk off characteristics. In other words, the managers actively manage these portfolios to provide reasonable returns when risk is reasonable but move to defensive investments when risk rises. We have a two-page report on the conservative portfolio available. As you will see over the last 21 years, these portfolios have achieved a 5.94% return with 4.47% volatility when the Aggregate achieved a 5.21% return with 3.40% volatility. Should these replace all your bond portfolios? We would say yes! That said, for many clients like easing into this asset and that may be the best solution for new clients. Just like we recommended with the Ark position which we started with a 33% allocation, clients new to Alternatives might start by selling 33% of bonds and putting that in the Conservative Portfolio and then gradually move more money out of bonds.
Income
The need for income is difficult today because of low rates. We were accustomed to getting 5% or 6% cashflow from bonds, yet today the coupons on high grade bond portfolios are in the 2%-3% range. These portfolios are not just for those who need or want income. As you have observed in reading this letter, we think capital appreciation will be illusive except for stocks in disruptive technologies. All our suggestions below have volatility much higher than bonds but represent stable income. We think of them as part of the overall allocation of client portfolios, those who need income and those who do not but want diversification. There are theoretically five ways to higher income, but as you will see, we are recommending only three of them.
- Buy Investment Grade Bonds at a Premium. It is true if you have bonds trading at a premium, you will have higher income. The problem is you know your clients will lose some of their principal by holding bonds to maturity. You have no clients whose investment goals allow for you to buy a bond at premiums and then see the premium disappear.
- Buy Below Investment Grade Bonds. This strategy is the most common way RIAs have dealt with this low-income problem. Temporarily, it is working. Our problem with this strategy is that the reason it is working is the Fed is preventing bankruptcies by buying bonds. While you may agree with this policy, it will end one day. If we knew when and how, we would be buying these as well, but no one does. There are lots of managers who have fabulous track records in the junk bond space, but no one has ever managed bonds in an environment with rates as low as they are today and no one has managed bonds when the Fed reversed the policy they have. In addition, the highest correlation to junk bond returns is small cap growth stocks, not the bond market. The option-adjusted spread between Treasuries and High Yield today is 3.5% and the historical default rate is 3% to 4%. In other words, the market is expecting return because the default rate will be very low or nonexistent, thanks to the Fed. This is playing with fire and will not end well.
- Our dividend portfolio can be a place to get reasonable income, but investors must be comfortable getting that income from equities which have higher volatility than bonds. We think this works but it requires a mindset adjustment. One caution in using this strategy, you must use Alternatives first to reduce the volatility of portfolios. If you just sold bonds and bought our dividend strategy, you would be dramatically increasing the volatility of the overall portfolio. The 60/40 client is not the 80/20 client.
- There are illiquid high cash flow investments with short maturities, 3-5 years, that are an attractive way of getting income. These portfolios yield 6%-7%, have historically had total returns of over 10%, and are structured so that the limited partners get paid before the general partners. We currently have two available and we would be happy to send you a one-page report on each of them
- We are finalizing the research on a portfolio of closed-end funds run by Mark Grant. We were hoping to have it available by now, but it will take a little longer. If you do not know Mark Grant, he is a fixed income thought leader, a prolific author and frequent panelists on various investment forums. The portfolio will have high current income, 8% to 9%, and be invested in closed end funds trading at par or a discount to par. More to come shortly.
Portfolios
The biggest change the RIA has ever been through is the change in the use of bonds. We will get accustomed to it, but make no mistake, it is dramatic. Combining dividend equities with disruptive technology portfolios will get us reasonable returns even though the S&P 500 is as overpriced as we have seen it. Alternative Investment portfolios will replace bonds and keep the integrity of your client portfolios intact. Illiquid portfolios with high cash flow will produce consistent income for clients needing it and good diversification and attractive returns for all investors whether they need income or not.
We stated earlier that we were excited about the future because of who we are as a country. We are also very excited about the future because these investment solutions will provide clients with attractive returns without increasing risk.