.png?width=2167&height=417&name=Greenrock-Logo%20(1).png "Greenrock-Logo")

Share this
by Kevin Malone on Apr 12, 2024
This Time it is Different
These are the most dangerous five words in the investing lexicon. People used the same, “this time it is different” sentiment in 1929, 1972, 1999 and in 2007, and suffered dramatically. The stock market is overpriced by any historical standard, and this time it is not different; it is just another mania, and it will end just like the others with stock prices producing negative, actually large negative returns. The poster child for this mania is Nvidia. It was trading at over $900 a share as of the end of the first quarter, which is 36 times sales. That is not expensive, it is insane. To put that in perspective, the highest the large cap stock market index has ever traded at is 3.1 times sales, and Nvidia is trading 11.5 times higher.
While it is true that we do not have data on how Artificial Intelligence will change our lives for the better, we do have history of what happened to the stock leaders after 1929, 1972 1999 and 2007. The best example is the history of Microsoft after 1999, and the mania was crazy then as well. Back then, the idea was that the cell phone and the internet were going to change our lives for the better, and they did. The problem was investors were asking the wrong question. The right question was what is the best investment strategy in a high-priced stock market environment. You may recall that the stock market was up over 50% in total during 1998 and 1999, and Microsoft led that market. Over the next 10 years, Microsoft fell over 50%. Now it did start to pay a dividend, so all was not lost. But over 10 years the price of a stock being cut in half tests anyone’s resolve. Now Microsoft did work out in the long run. If you had bought Microsoft at the end of 1999 and still hold it, your return would have been 10.5% for the entire period. All you needed to do was live through a 10-year 50% decline! It would be cynical to say that no one did hold, but we think not many did.
We have data on the price to sales ratio of large cap domestic securities dating back to 1871 thanks to one of our managers, 3EDGE Asset Management. They use price to sales data rather than price to earnings data because price to sales is harder to manipulate than price to earnings, and we agree with that analysis. Students of the markets will remember the late 1990s when earnings needed to rise every quarter or companies were punished by institutions selling their stock. That seemed crazy to us then and it was finally dropped as a thought in the early 2000s as the stock market declined by over 50%. It demonstrates how earnings can be manipulated for a purpose other than explaining to the investment community how a company performed in any quarter.
There are 1,838 months in the data we analyzed from January 1871 through February 2024. During this time, the Price to Sales Ratio has ranged from 0.40 to 3.10, a remarkable range. While we know that emotional factors dramatically influence stock prices, both positively and negatively, this range is dramatic. As of the end of February of this year, the Price to Sales Ratio of domestic large cap stocks was 2.73. So, let us put that in historical perspective to see if we think stocks are fairly priced, underpriced or overpriced today. The chart below shows the frequency the Price to Sales Ratio of the domestic large cap stocks have been in four categories, over 3.0 times sales, between 2.99 and 2.50 times sales, between 2.50 and 2.00 times sales and under 1.99 times sales.
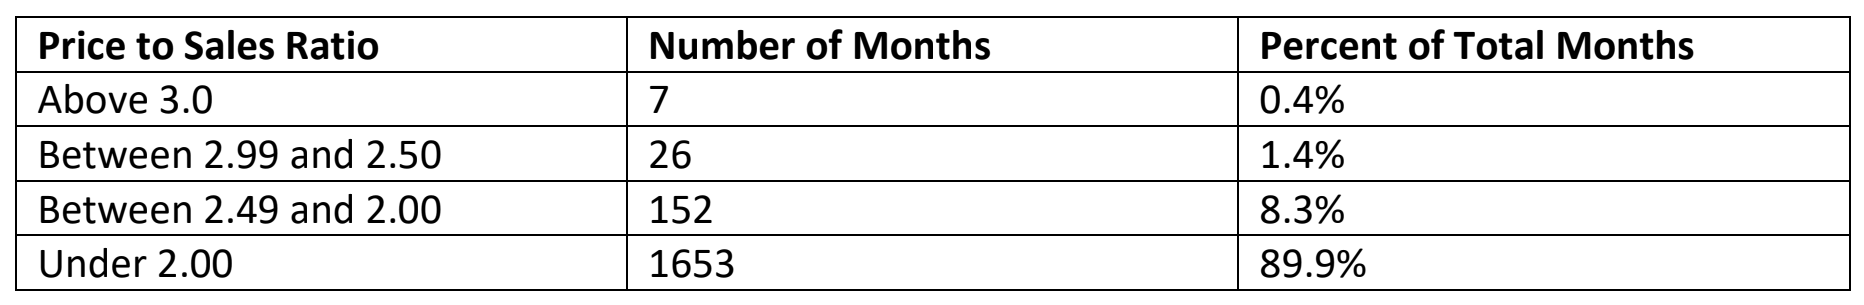
So, today, with stocks priced at 2.73 times sales, they have only been more highly priced less than 2% of the time, 1.8% to be exact. That is rare by anyone’s standard and if it turns out that if we are right and this time is not different, future returns from indices will be abysmal. They will not solve the investment return needs of any clients, just like the decade of the 2000s when the same phenomenon existed.
This must worry you about our domestic equity portfolio?
The honest answer is that we are not without worry. Any time stock prices are high, everyone should wonder about future returns. Historically, our dividend strategy has fared very well when markets produce low or negative returns. In 2022, when the S&P 500 was down 18%, our domestic dividend portfolio was down only 2%. The same was true in 2000-2002 as well as 2008. So, we are confident we have the right strategy, but declines are difficult for everyone, even in times when we have protected very well. We invest to achieve our long-term goals, and down 2% in 2022 protected well. We still need a time of positive returns to achieve our client investment goals.
The source we use for thinking about future returns is Research Affiliates. They publish daily their projected future returns 10 years out. Today they are projecting an annualized, compounded return over the next decade of 0.8% for domestic large cap stocks. That makes sense, if stock prices are high, future returns are projected to be very low. Today is no exception. So, even with all of the optimism of Artificial Intelligence, stocks project low future returns. Is this just because the general market does not understand AI and the impact it will have on our lives and so many companies? The answer is that sentiment is very unlikely. The real reason is there is too much optimism. Now we are optimistic as well, but our optimism is a different kind of optimism. If you thought of optimism on a continuum with realism at one end and blind optimism on the other end, we are at the realistic end and the buyers of Nvidia are at the blind optimism end. So, we like our position.
In addition, we have allocations to domestic small cap and international stocks, and their projected returns at Research Affiliates are 6.3% and 4.6%. Now those numbers are for the indices, and we have performed and expect to continue to perform much better than the indices. Historically, dividend strategies outperform in low or medium return markets.
So, we like our position.
Bitcoin, the Halving and Expected Returns
Many of you have put Bitcoin in clients’ portfolios. We are certain you all kept up with the launch of the 11 Bitcoin ETFs in January of this year. The anticipation of the new ETFs was at a very high pitch, but the accumulation of assets into these ETFs has been beyond belief. More assets have been invested in Bitcoin ETFs than in any new investment in history. Today, there is more than $35 billion in Bitcoin ETFs. It is hard to put that in perspective, no one projected or anticipated this, and the accumulation seems to be continuing.
It is hard to keep up with the new stories of who is buying and in what quantity. Our favorite headline was that the Harvard endowment was investing 7% of its assets in Bitcoin. The story was incorrect, it was the part of the endowment run by its students that was investing 7% in Bitcoin, not the endowment in total. Michael Saylor, Executive Chairman and Co-founder or MicroStrategy has led its company’s investment into Bitcoin, and today they own 1% of the outstanding Bitcoin. So, there are plenty of good news stories on Bitcoin and why one should own it. We agree! We think almost all clients should have a small piece of Bitcoin, in general 2% to 5% of total portfolio assets. That said, no one should invest in Bitcoin who cannot withstand dramatic volatility. Periods of time when Bitcoin declines over 75% are common, and we do not think that will change.
Approximately every four years, the rewards that go to miners of Bitcoin is cut in half. This month will be another halving. Historically, this has been a time when the price of Bitcoin rose. We expect that to happen this year and next as well. Bitcoin has been both the highest returning asset since its inception, but it has also been the most volatile asset as well. Now there are projections of returns on Bitcoin over the next 18 months of as high as 10 times its present value to only 3 times its present value. Any investment that returns 3 times its present value over 18 months is unusual and to be treasured. So, we have no way of knowing what might happen over the next 18 months, but we do think if you are going to put Bitcoin in clients’ portfolios, you need to expect volatility at very high levels. If you had bought Bitcoin 4 years ago, you would have paid slightly less than $10,000 per coin. The price then went to $65,000, and at the end of 2022 it was trading at $15,000. It is trading around $70,000 today, and many analysts think it will rise from here. Will it go to $200,000 or even $700,000 a coin? The easy answer is no one knows, but we feel confident if it does rise over the next 18 months, it will correct from there just like it has in all cycles.
So, with that as background, these are our thoughts on putting Bitcoin in client portfolios:
- Use only a small allocation of Bitcoin, 2% to 5% of assets.
- Expect remarkable volatility, and by that we mean expect big paper losses from peaks.
- Trim allocations if Bitcoin rises from here.
- Do not think the patterns of the past will be the exact future. No one knows the future.
With all of that said, we do think Bitcoin represents a store of value, and long-term investors will be rewarded.
Private Investments
Our expectations of total returns in public markets are low. We talked earlier in this paper about Rob Arnott’s projected return for domestic large cap securities is 0.8% annualized for the next 10 years. While we should not take this number as a literal prediction, it does represent a prediction that returns will be low. There is historical data that shows us these types of returns can happen. During the decade of the 2000s the annualized return of the S&P 500 was -0.9% per year. This meant that $1 invested in the S&P 500 index at the beginning of the decade was worth 91 cents 10 years later. Our dividend strategy during that decade compounded at 7.7%, so almost every client achieved their investment return goals during that decade. Our expectation is the next decade will see our dividend strategy perform in a similar way.
Today we have several private investments with projected attractive returns and reasonable current cash flow. Three of them offer a 6% current yield and projected total returns of 15% or greater. Now we know that many clients are accustomed to giving up liquidity, but we would suggest all clients can live with some level of their assets invested without liquidity. You will need to determine the level for each client. We would suggest that the current cash flow and projected return combination should be attractive to almost all clients. These portfolios have maturities between 3.5 and 4 years, and our expectation of total return of 15% or greater. We would encourage a discussion on how these might work in your client portfolios. We have some strategies that require clients to be accredited and some that do not.
Patience and Impatience
There are no secrets to long tern investing success, you need a proven long-term investment strategy and patience. The patience part is really hard! Every market tests our patience, and when you have an equity strategy like our rising dividend strategy you can look foolish at times. Now historically the times you look foolish is when very high-priced stocks are being rewarded like they were last year and through Q1 this year. So, today we find ourselves impatient with stocks like Nvidia that are at insane levels, and patient that our dividend strategy will see its day to shine soon.