.png?width=2167&height=417&name=Greenrock-Logo%20(1).png "Greenrock-Logo")

Share this
by Kevin Malone on Jun 30, 2021
The Bond Market went from Broken to Producing Losses
We have been warning about the potential of rising rates and the impact of bond returns. The total return of a bond portfolio is made up of two factors: the coupon and the appreciation or loss based on the change in coupon on a similar bond over time. The 10-Year U.S. Treasury started the year with a yield of 0.91%. What we know is that if the yield remained unchanged for 10 years, the annualized return of the bond holder would be 0.91% per year for the next 10 years. This is the calculus that had us warning the bond market was broken and no longer a viable place to invest for clients because the expected future returns would be too low. How many clients in your book would be happy with an annualized return 10 years from now of 0.91%? Further, how many clients could achieve their investment return needs over the next 10 years with a return of 0.91%? Our guess is you could not achieve any client’s investment return needs and no clients who would be happy with that return. Yet, that is implicitly what investors were doing on January 1 of this year by buying the 10-Year U.S. Treasury.
Now it is true you can find bonds with higher yields than the 10-Year, and this is what most investors have done, taking comfort in the higher yield. So, we would ask how much more and what does history show us about those higher yields in various corporate bonds. For purposes of this discussion, we are eliminating any reference to High Yield. Investors using High Yield are playing with fire and may not realize that the highest correlation of High Yield is to Small Cap Domestic Equity not to any bond index.
What we know with certainty is that neither the price of the 10-year nor any bond will carry the exact same yield over the next 10 years. Actually, we know no bond will carry the exact same yield over any single year. Rates change constantly as investors digest more data on current and future economic activity, thus changing their view on the right price and the right yield. Some of these moves are quite small while in other periods the changes can be large. This year is an example of a rapid change. The 10-Year started the year at 0.91% but has traded over 1.75% and ended the quarter with a yield of 1.74%, a 91% increase in yield since the beginning of the year.
A 91% change in anything, even a speculative stock, in three months is dramatic, but perhaps even more dramatic because of how we think about bonds. They are supposed to be safe, low volatile investments, not have over 90% changes in yield over 90-day period. We can speculate on why this may be happening, and most of us would say the possibility of higher inflation is likely the answer. But we would argue that the reason is less important than the fact that that you can have such a dramatic move in a theoretically low volatile asset class during such a short time. So, let’s look at the impact of this move on the price of the 10-Year. Chart 1 shows the rise in yields and the corresponding decline in price.
Chart 1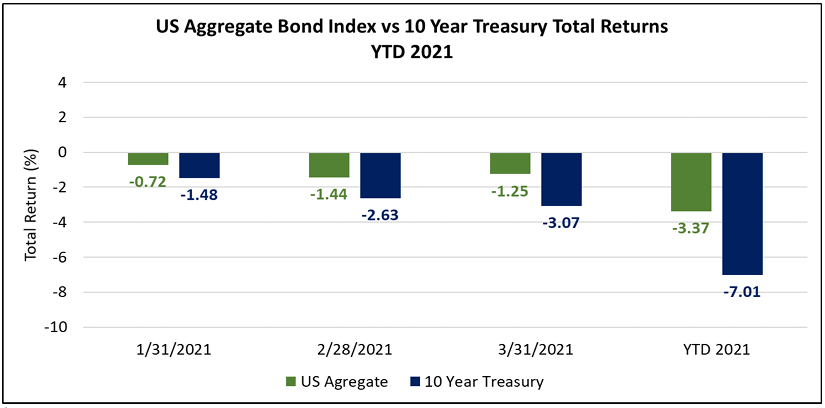 Source: Morningstar Direct
The math of this decline is dramatic and dreadful for bond holders. Anyone who owned the 10-Year at the beginning of the year has seen a decline of 7% over the last three months. Putting that in perspective, the 10Year had a yield of 1.74% at the end of March which means that the loss of 7% in the last three months represents -402% of the expected income from the bond. Said another way, it will take 4 years to recoup this loss. So, while we know they will not, if bond yields were flat for the next 4 years, the total return of the 10Year would be zero. The good news is there would be no volatility, but we doubt your clients will take comfort in no return coupled with no volatility.
I can get higher yields with corporate bonds!
This is true, and the best proxy for that has been the Bloomberg Barclays Aggregate Bond Index which has been around since 1981. The AGG, as it is affectionately known in bond market circles, is a diversified intermediate bond fund with an average maturity between 4-5 years. The AGG invests in treasuries, corporates, agencies, mortgages and a small amount of locally traded foreign bonds. It is the gold standard for which taxable bond managers aspire. We have interviewed hundreds of bond managers over the years, and almost every bond manager tells us it is the most unfair comparison for bond portfolios. Their complaint is that the AGG owns everything, and a bond manager cannot replicate it. We think there is some truth to this complaint, but we need to have some comparison so why not a tough one.
By investing in all sectors of the investment grade bond market, the AGG can have a higher coupon than the 10-Year. That is true today and has been true through the life of these investments. The question is did the AGG outperform the 10-Year over time? Chart 2 shows the returns of both.
Chart 2  Source: Morningstar Direct
As you can see over the last 40 years, the AGG has compounded at 7.50% while the 10-Year compounded at 7.21%. So, the point is right, by diversifying one’s bond portfolio into areas which the AGG uses, you can get a higher yield and higher total returns. The correlation of the AGG and the 10-Year is also extremely high. There are times when government bonds lead a change in rates and times when they lag. But over time, both the AGG and the 10-Year get to the same point.
The interesting issue from our standpoint is the total return difference between the AGG and the 10-Year over this 40-year period. It is just 0.29%, much smaller than almost all investors would guess. We think conventional wisdom about bonds is that using treasuries like the 10-Year will get you much lower returns than mortgages, bank loans or corporates. The reality is that over time, this is just not true. What is true is you will get higher income and higher total return, but by much less than you think. In the case of the last 40 years, you got 0.29% higher.
What Do We Do?
What you have to do is realize that you cannot use bonds like you have in the past. You cannot achieve your clients’ investment return needs with bonds, and you need to address that in your clients’ portfolios. This year has wiped out all the income of any fixed income portfolio for this year and next, meaning if you are lucky your clients will break even in 2023. The financial planning you are doing needs to be reflective of this reality. If you are using bonds in client portfolio allocations, you need to project very low expected returns. We think projected returns of even 2% annualized are not realistic. We think realistic return projections over the next 10 years should be no higher than 1%. We also think your clients can understand that and will realize why bonds are no longer a viable asset class.
The direct answer to what you should do is sell most of your bonds and find other low volatile investments that have similar income and the prospect of a reasonable return. We have been using a diversified ETF portfolio that we call the conservative portfolio for over 20 years. We used to think of it as a complement to bonds, but today we think of it as a substitute to bonds. Historically, the conservative portfolio did not have an income level like bonds, but today it does, at times even higher. We have a report on it and would be happy to go over it with you. During the 20 years we have been using the strategy, our clients have achieved a return greater than the AGG, the bond index bond managers cannot outperform, and done so with similar volatility as the AGG. While we project the bond market will get your clients an annualized return of 1% over the next decade, we think this portfolio will realize an annualized return of 5% and do so with similar volatility to bonds.
But what if rates go back down?
Rates will decline at some point because economic conditions or investors’ perceptions of economic conditions will change. But decline from what level? The 10-Year at today’s level of 1.74%? From 2.0% From 2.5%? From 3.0%? If we knew or we could find someone who knew we would act on that, but the reality is no one knows. Bonds are a broken asset class and the longer we wait to act on that the more we will hurt our clients. Our best guess is rates are much more likely to rise from here, exacerbating the problem, than they are to fall from here.
The Stock Market
The change in rates that has impacted the bond market has also impacted the stock market. We have been writing over the last few years about how a few growth stocks have driven the index returns. The rationale for these stocks to have dramatic rises has been the low level of interest rates. The idea was that while rates are so low, P/Es can rise. So, we saw the FAANG stocks and Microsoft rise dramatically while analysts continued to suggest that high P/Es and Price to Sales were justified because interest rates were low and declining. Growth not just outperformed value, it made a discussion of investing in value seem like an idea of a former time. While rates were low, all you needed was growth.
Welcome to reality! Nothing goes up forever and the rationalizations about why a concentrated number of stocks drive markets historically has always ended very painfully. This time will be no different, no matter what you think of Apple and Amazon.
Chart 3 shows the returns for Q1 of the various equity indices.
Chart 3 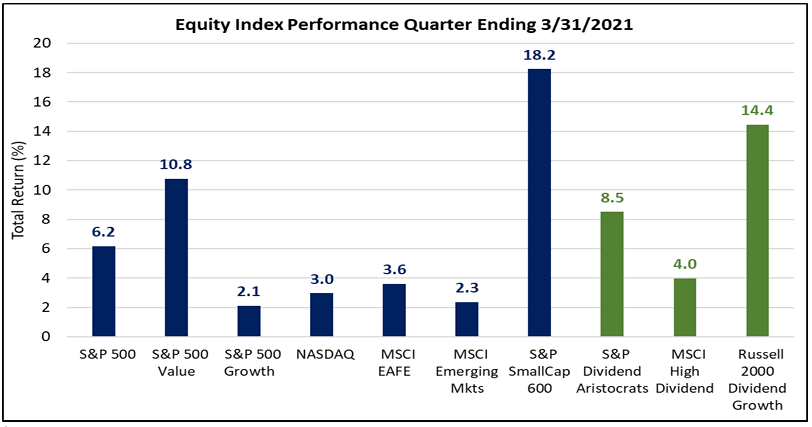 Source: Morningstar Direct
As you can see, value and dividend strategies outperformed growth, and we would add, “Finally”! The absolute returns are quite high. If the S&P 500 is up 6.2% every quarter this year, the total return for the year would be 27.2%. If our portfolio, which was up 7.7% for the quarter, continued that exact return for the next three quarters, our accounts would be up 34.5% for the year. While it unlikely this will happen, it is nice to have a good quarter.
The Fed and several investment banks are projecting high GDP growth for the year, over 6%. This could very well happen as we recover from the pandemic. Whether 6% or 7% is the right number remains to be seen, but our economy is recovering, and we have people getting vaccines at a high rate. That should allow all of us to return to restaurants, the theater and sporting events as well as get back on airplanes and take trips. Everyone is excited about returning to normal, even knowing normal will likely not be exactly what it was before the pandemic.
The question is what will happen to equity prices in this environment over the remainder of the year? Is 6% or 7% GDP growth already priced into stock valuations? We think the economy will do well, and in addition it is highly likely we will have a significant infrastructure bill passed reasonably soon which will further move our economy forward. If that does happen, unemployment will be reduced, and our economy will get a boost. So, not only do we think this year will see attractive GDP growth of 6% or so, next year will likely be high as well. Likely next year is not 6%, but it will also not be the 2% we have seen in recent years. So, expect a good year in the stock market.
The important data point to determine returns will be the level of interest rates. If rates rise gradually and the 10-Year stays below 2.5%, we would expect stocks prices to do well. We would also expect our dividend strategies to outperform growth. The higher rates go, the better the environment is for dividends and value to outperform growth.
The other important data point to remember is that stock prices do not rise in a linear fashion. Every quarter this year will likely not be positive, and do not be surprised if growth has a quarter outperforming dividend strategies. But it is reasonable to expect attractive, double digit returns this calendar year.