.png?width=2167&height=417&name=Greenrock-Logo%20(1).png "Greenrock-Logo")

Share this
by Kevin Malone on Mar 31, 2023
Stock Market Decline, Correcon or Bear Market
The first quarter of this year started with a bang. The S&P 500 was up 6.28% in January and if you followed the financial press there was a tremendous amount of optimism about the future. Then February hit us with reality. February saw the S&P 500 return -2.44%. March saw a return to positive returns, up 3.67%. Optimism followed by reality followed by optimism! So, which is it? Have we seen the correction, that is last year, we will see? Is there more to come? This is what makes markets, the uncertainty of the future requires us to make judgments and those judgments are far from perfect. So, let’s look at where we are.
I had a conversation this past quarter with a person I consider a remarkably astute investor and a very smart guy. He is a student both of history and of the various markets. He is one of the people with whom I check in regularly to take his temperature. We have certainly not agreed on markets all the time throughout our history of sharing our thoughts, there have been times when he was right and times when I was right. The insights we covered in our conversation this quarter are worth discussing. I went through my concerns about the economy, the price level of domestic equities, current and future unemployment, curbing inflation and what will happen to corporate earnings later this year and into next year. The opinions I expressed were that with these issues unanswered and the likelihood of all of this coming out positive seems very unlikely, we are worried that a continuation of the market decline we had last year is very likely.
These are our concerns:
- The economy - We are concerned about the fragility of the economy. We worry that the economy may not be as strong as many suggest.
- The price level of domestic securities - We use the price to sales ratio because sales cannot be manipulated the way earnings can. We have data going back 120 years. Today, the price-to-sales ratio of the S&P 500 is in the top 5% of all periods. So, stocks are not just expensive, they are very expensive.
- Today we have full employment, but we wonder for how long. Several tech companies are laying off significant numbers of employees. We are even seeing industrial companies following suit. McDonalds just announced they were shutting down their corporate offices for a few days to determine layoffs. All of this makes us wonder for how long we will have full employment.
- Inflation is high and rising and the Fed is not happy about that. All of us see it in our everyday lives, go look at the price of eggs. The Fed has raised rates more than they originally thought they would need to, and we wonder if the end is in sight.
- Corporate earnings look great, but we worry what happens if the unemployment level rises or if inflation continues to be a problem or if the economy slows down.
So, this is a list of concerns, and we do not have the answers today. It might be we will find out there was nothing to worry about, but to us it sure does not feel that way. So, after expressing all of this to my friend, he agreed with my concerns. He even said he did not think we would come out of this with all great answers to these concerns. What he said next is what was surprising to me; he said he thought given all of those concerns that the stock market could be down as much as 5% this year.
While I was surprised by his analysis, I do not think his opinion is an isolated one. From our view the concerns suggest a much different outcome, but I understand where he and many other analysts are coming from. I am reminded of some research I did in preparation for a speech to a group of RIAs in 2004. They asked me to talk about what investments strategies were likely to do well given the bear market of 2000-2002 and the recovery of 2003. The work I did on the 2000-2002 bear market is what I think might be helpful to reflect on today.
The return of the S&P 500 in 2000 was -9.1%, in 2001 was -11.9% and in 2002 was -22.1%. For the speech, I reviewed the headlines in the financial press during these three years. They started out in 2000 praising the stock market which had just finished an 18-year run of positive returns with annualized returns well above long-term averages. They were suggesting a continuation of this grand bull market. As we got past 2000 and into 2001 with the stock market down 9.1% and then 11.9%, the mood changed to what I would call cautious and somber. The headlines changed, urging investors to be certain their risk level was correct. As we got into 2002 the mood changed dramatically as reporters turned into analysts suggesting the stock market was just a place for risky investments and questioned the future.
So how did this happen? Our view is that it is human nature. People generally are optimistic, sometimes blindly optimistic. When stocks start to decline, investors do not believe. Rather, they think this is temporary. As stocks continue to decline, investors get more realistic and simultaneously get scared. That is what happened in the early 2000s and that is the phenomenon today. After last year, January of this year was a welcome relief and our tendency toward optimism impacted our view. True, February slowed us down a bit but March saw a return to optimism. So, where are we now and will our cautionary position or the optimism of my friend and many others prevail?
Our Analysis
The best guide for predicting future returns is current prices relative to their history. While many analysts use P/E ratios, we use price-to-sales. We do so because earnings can be adjusted much more easily than sales. We have data going back 120 years. The review of the price-to-sales ratio of the S&P 500 as of the end of last year showed that it was in the top 5% of all P/S ratios going back 120 years. While this is alarming, we decided the P/S ratio of many times over the last 120 years might have been artificially low. In addition, today we live in a time of rapid technological change which could suggest that the lower P/S ratios of our history might not be repeated. It might be that stocks just trade generally at higher P/S ratios in the future. So, we took out the bottom half of all P/S ratios over this 120-year period whenever they occurred. What we hoped we had was a universe that might be more reflective of future P/S ratios. When we did this, we found that the P/S of the S&P 500 as of the end of last year was still in the top 5% of the remaining P/S ratios. We think this is critical to understand because we can examine other periods when P/S ratios were high and review returns that followed.
There have been two long periods of declines in stock prices over the last 60 years, and each of them lasted for a decade. The first period was 1965-1974 which saw a total return of 1.23% per year and had several large declines within the decade. The second was the decade of the 2000s which saw a total return of -0.95% per year over the decade but also saw two major bear market periods, 2000-2002 and 2008. Last year, we saw the decline of -18.1% in the S&P 500, and we believe was the start of a decline like these other periods, but we will need to see how the next few years evolves. The history of general and lengthy stock market declines is that they are not linear. Markets do not just go straight down and then head straight back up, and there is no reason to believe this market decline we are in will be any different. You need to remember that during the decline in stock prices that followed the Depression of 1929, there were three periods of stock advances of over 75%. All of these were accompanied by analysts expressing relief that the decline in stock prices was finally over and the future looked rosy, only to be followed by markets making new lows. So, what will this quarter be, a reprise in a bear market or the beginning of another bull market? We would urge caution. Even in the unlikely event that all of our concerns turn out to be just worries, that everything turns out fine, we still have the biggest worry that all investors should have and that is that stock prices relative to their history are very high. As we state above, the P/S is in the top 5% of P/S history, and that does not suggest high future returns.
Rob Arnott manages a firm called Research Affiliates. They manage funds and publish research on investing. One of their publications makes estimates of the future return of various asset classes 10 years from now. These are their projections for various asset classes 10 years from now.
Domestic Large Cap Equities 2.25%
EAFE 6.9%
European Equities 6.2%
Emerging Markets Equities 8.1%
Aggregated Bond Index 1.6%
Corporate Intermediate 1.9%
If these estimates are even close to what we experience, we should not own bonds or domestic equities, and we should over weight EAFE and emerging markets. This highlights the problem of thinking about investments relative projections. No one is going to dramatically over weight international and emerging markets sufficiently.
Our Advice
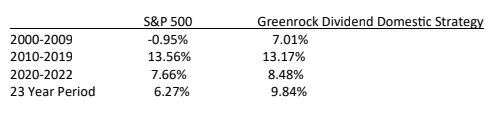
If you agree, and I am sure you do, that dramatically overweighting international and emerging markets is not something you would recommend to your clients, then what do you do? The quick answer is you need a domestic equity strategy that will get you more consistent rates of return, and it will be no surprise to anyone that the strategy that accomplishes that is a growing dividend strategy. We have been managing these portfolios for 23 years, and that period can neatly be divided into the first period of slightly negative returns for the domestic stock market followed by a long period of above average returns. We will divide this period into calendar decades, the 2000s and the 2010s and then the last three calendar years. Below are the results.
If you couple this data with the up capture/down capture data of the index and the dividend strategy, you have data which is compelling. Here is why.
- It produces a higher return long-term than the index, in this case 9.84% vs 6.27% over 23 years.
- It reduces the down capture of the index, in this case by 40%.
- It underperforms in straight up markets, especially those where the market gets to extreme valuations. However, during these periods, dividend strategies solve the investment return needs of almost all clients.
- It produces returns in flat markets that solve the investment return needs of almost all clients.
This is why we use our dividend strategy and why today is a time when the future looks very bright.