.png?width=2167&height=417&name=Greenrock-Logo%20(1).png "Greenrock-Logo")

Share this
by Kevin Malone on Sep 30, 2019
The stock market is telling us the economy and our economic future is rosy.
The bond market is warning us of slow growth ahead and perhaps a recession.
Which one should we believe?
The S&P 500 is up 18.54% for the first 6 months of 2019. Five of the six months saw positive returns with only May having what might be categorized a correction. If the stock market is a leading indicator of future economic activity, the future looks great. First quarter GDP was 3.1% and the stock market is indicating more of the same.
The bond market has also achieved attractive returns for the year. The total return of the 10‐Year U.S. Treasury was 7.44%. The yield on the 10‐Year has gone from 2.66% to 2.0%. While bond investors are happy, we have two concerns with the movement of the bond market. First, current bond yields project very low future returns from bonds; and second, low yields are historically a leading indicator of future low growth levels for our economy.
So, which is it? Will future economic activity follow the path the stock market is suggesting with high GDP growth? Or will future GDP growth be low as the bond market is suggesting? Let’s start with a little review of historical GDP growth.
The first chart shows GDP growth in this country from the end of World War II through last year. You will see we have divided this period into two parts, the high growth period of 1945‐1999 and the low growth period of 2000‐2019.
Chart 1  Source: St. Louis Fed (FRED)
We would make the following observations for this chart:
- Our country went through a period of very high growth after World War II as we rebuilt America. The baby boomers were born from 1946‐1964. We had full employment, upward mobility and life was good. The hangover from the Great Depression was finally behind us.
- The 1982‐1999 period saw the baby boomers come of age, and our stock market achieved an annualized return of 18% during this period.
- The slow growth of the last 19 years has been exacerbated by the retirement of the baby boomers and a general slowdown in global growth. This has been reflected in returns from the stock market as the S&P 500 has compounded at 5.2% from 2000‐6/30/2019.
So, this begs the question of whether we have now entered a period of high growth again like the 1982‐1999 period. We think it is hard if not impossible to make this argument for the following reasons.
-
The 1982‐1999 period was categorized by reasonable levels of debt, fabulous demographics and reasonable inflation. Today we have very high debt, terrible demographics and likely deflation.
-
The demographics of developed countries globally is not predictive of high growth, in fact, it is predictive of low growth. This has been true in Japan for 30 years, and it is now true of our country and Europe. After World War II we had 16 people working for everyone retired person. We are headed for only having 2 people working for every retired person. Working people contribute to GDP growth; retired people do not.
-
2018 saw GDP growth of 2.9%, which was applauded and welcome. It came about because of lower taxes for corporations and individuals. The price of that growth is estimated to be $1 Trillion of deficits and therefore debt over the next decade. Lower taxes are a good thing, but they only contribute to GDP growth once. We would need more tax cuts this year or in the future to continue to get the same benefit, and that seems highly unlikely.
-
Our debt is a head wind to growth. Corporations expanded their debt over the last decade as interest rates were low. BBB rated bonds went from $700 billion in 2008 to $3 trillion today, and now account for 50% of corporate debt. Thirty years ago BBB debt was 20% of corporate debt. Government debt, student loans and personal debt also saw dramatic expansion over the last decade.
-
The increase in debt did not come with commensurate corporate profits. From 2010 to 2018 total corporate debt went from $6 trillion to $10 trillion and corporate profits went from $1.7 trillion to $2.2 trillion cumulatively during this period. So, we borrowed $4 trillion to get $500 billion in profits over this 8‐year period. The borrowing cost of this new debt increase marginally, slightly over 20%, yet we could only generate cumulative profits of $500 billion. The growth in profits annualized at less than 3% during this period.
The critics of this logic will point to U.S. companies achieving 30% EPS growth over the last 5 years. The facts are profits are flat during this period, corporate buy backs created fewer shares thus higher earnings. One statistic that is interesting is that in the last year capital spending by corporations on research and development was 1/6 of the amount spent by our corporations on buy backs. Top line growth appears to be something of an historical concept.
The critics will also point to the 3.1% GDP growth of Q1. The primary cause of that growth was dramatic stock piling of inventories as China faced the uncertainties of tariffs and the UK faced the uncertainty of Brexit. The best perspective on this topic comes from the Fed, and they are suggesting GDP growth will be 2.1% for this year in spite of a good Q1.
The critics will also suggest we see no signs of deflation. We would suggest one only has to look at global government debt rates. We have $12 trillion of government debt around the world with negative rates attached to that debt. Now it is easy to ask why anyone would do that, and we wonder that as well. But the facts are that there is $12 trillion where investors essentially agreed to get most of their money back 10 years from now or longer. They must believe we will have deflation and most of your money 10 years from now will have greater purchasing power than it does today. Likely they also do not trust their mattress.
You may read some critics of the deflationary argument that when fully analyzed are a difference without a distinction. The yield on the 5‐year TIPS today is 0.21%, thus inflationary not deflationary. If inflation over the next 5 years averages 0.21% or ‐0.21% will there be a real difference? We would suggest that very low growth or slightly negative growth will feel the same.
The real driver of deflation is the demographics of the developed world globally. The U.S., Europe and Japan all have too many people who have entered or soon will be entering their retirement years.
Lacy Hunt, chief economist at Hoisington Capital Management, gave a talk at the Mauldin conference in April on the impact of higher debt levels. He presented two theorems. He suggested that Federal debt accelerations leads to lower not higher interest rates. He also suggested that monetary easing leads to lower not higher interest rates. He made the case that debt acceleration slows GDP growth and thus the demand for more debt. He also suggested monetary easing creates a decline in the velocity of money. We have had both high levels of government debt and an easing of monetary policy by the Fed. Dr. Hunt is suggesting we will start to pay the price for that with lower GDP growth.
We think this is what we will see. It is what the experience of Japan was and still is as they went through and continue to go through very slow growth, a poor demographic population and seemingly no hope in sight for a reversal. So, we would suggest we take the movement of the bond market seriously. Low GDP growth and low inflation is what we have experienced for the last 19 years. The catalysts for a change in that direction are difficult if not impossible to find, and future returns will be related to these facts. High levels of debt, poor demographics and deflation or very low inflation are an awful combination for future GDP growth.
What about asset prices today, dear or cheap?
Our stock market has very high prices. Chart 2 shows the PE of stocks since World War II. You will see prices are high, and we believe can only stay high if the fundamentals follow. To us this looks highly unlikely. The most compelling statistic on the overvaluation of our stock markets one is paying $1.50 for $1.00 of current GDP. This relationship was more expensive in 1999 but not much more expensive. 1929 was the only other time when this premium was this high.
Chart 2 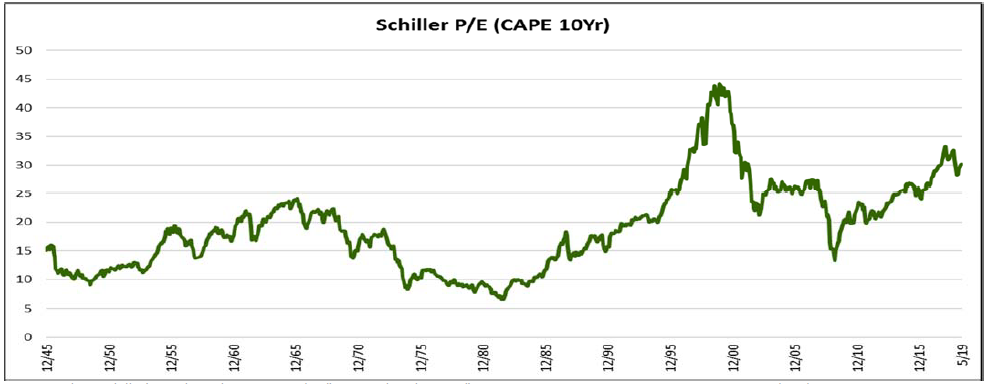 Source: Robert Schiller’s Stock Market Data Used in "Irrational Exuberance" Princeton University Press, 2000, 2005, 2015, updated.
The Fed
The Fed in their June meeting did not lower rates but suggested that was a possibility in July. We find this interesting. We have full employment, positive GDP growth, very low interest rates, negligible inflation yet the Fed believes the economy needs a boost.
Lowering interest rates is historically what the Fed has done after an economic downturn or a recession, not in times like we have right now. This looks to us like a signal that perhaps the economy is not growing at an acceptable pace. Perhaps the Fed is suggesting they need to get out in front of some trouble ahead.
So how do you get return in low interest rate environment with slow GDP growth?
Every environment presents investment opportunities, the key is to get the factors of the environment right. We see three things that will drive returns. Bonds will provide reasonable returns until yields reach their lows. Equities will move away from an emphasis on growth stocks to an emphasis on high cash flow and conservative balance sheets, the perfect environment for our growing dividend strategies. Alternatives managers like 3EDGE and Forefront will preserve buying power as they have in past declines, creating an opportunity to achieve reasonable returns.
Bonds
While rates are low, the 10‐Year did trade at a 1.46% yield on July 1, 2016. David Rosenberg of Gluskin Sheff and Associates believes we will not only test that low but go lower. He is suggesting we may see the 10‐Year as low as a 1% yield. If you do not recall David Rosenberg, he was the chief strategist for Merrill Lynch who called both the top of the market in 2007 and the bottom of the market in 2009.
We can quote other sources, but this is the spirit behind our view of having some, not a lot, fixed income inportfolios. We will very likely change that view if this prediction comes to reality. At some point as yields get into the 1% area you would have to wonder what purpose they hold in portfolios for most investors. They certainly reduce the volatility of equities, but the return levels will not achieve your client’s investment return needs.
Equities
The last ten years have seen dramatically higher returns for domestic large cap growth stocks than for any other asset class. Chart 3 shows the history of the relationship between growth and value. This chart may have you thinking of 1999. We think this coupled with the realization of slow GDP growth will cause the shift away from growth stocks and toward value stocks. When value leads growth, our dividend strategies shine.
Chart 3 Source: Morningstar Direct
Chart 4 shows the return of the S&P 500 Index vs. an equally weighted FAANG stock portfolio. As you will see their return was dramatic. Now you may recall the same phenomenon existed in 1998 and 1999 when the top 12 stocks and then the top 7 stocks provided the entire returns for those years respectively. Today critics of this comparison will say that the FAANG stocks are better companies than were the darlings of the 1998‐1999 period when Cisco, Microsoft and Qualcom led the way. While this may be true, that does not answer the question of price relative. Remember Microsoft’s price peaked at the end of 1999 and it took over 15 years to get back to that level. So, assume the critics are right and this time it will not be so bad, and tell us you would feel good if this time it only took 7 years to get to break even.
Chart 4 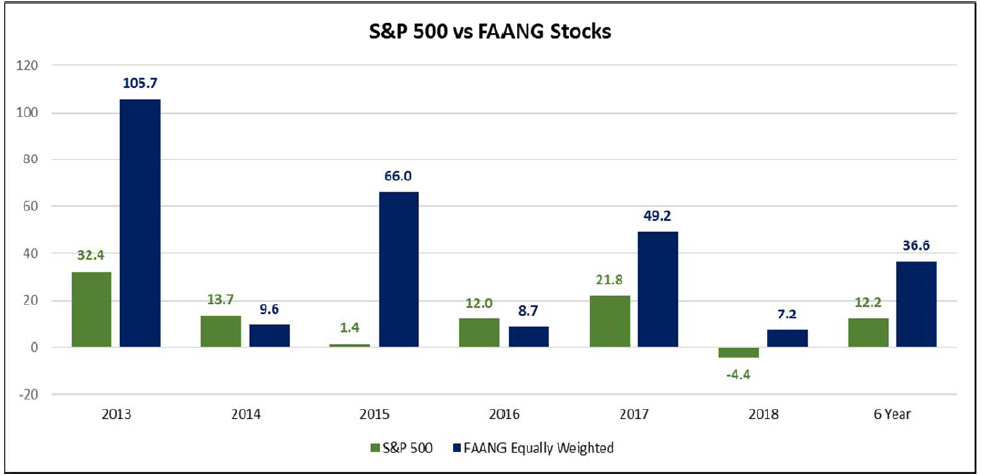
What did work in 2000‐2002 when the S&P 500 fell 38% was growing dividend stocks. Our portfolios during these three years were up over 17%. David Rosenberg suggests that the return of the S&P 500 from 6 months prior to our next recession to three months before it ends will be ‐22.7% while the return from dividend stocks will be +12.7%. So, while our equity portfolios which have lagged over the last years, particularly in 2013,2014 and 2017, we believe they will be the place to be as we look into the future. Just as an aside while David Rosenberg, or any other economist, would be the first to say it is impossible to predict the date of the start of the next recession, but his prediction is Q4 of this year or Q1 of 2020. If he is right the return of stocks in the second half of 2019 will not be good.
Alternatives
Our commitment to liquid alternative portfolios has not paid off in 2018 or in 2019. Our question for ourselves is that if we do have a recession will they perform? Today both 3EDGE and Forefront have risk off in their portfolios. We think that is the right place to be. Finding the right date for the start of a recession is impossible, but there are some ominous signs. The yield curve is inverted, PE expansion has come from buy backs not top line growth, we have enormous debt and lousy demographics.
What if we are wrong?
It is absolutely possible that we are wrong, and this stock market may continue to rise. There are no rules that suggest we cannot have a stock market rise longer than 10 years or an economy that continues to have positive GDP with an inverted yield curve.
Our allocation for core clients includes a 50% allocation to equities, so we are not saying trouble is coming run to cash. We are saying the likelihood is the types of conservative stocks in our portfolios will do well. There is evidence of that over the last 18 months. Dearborn Partners domestic portfolio outperformed the S&P 500 two of the last three calendar years and is outperforming this year. Over the last 12 months Dearborn is up 18.8% while the S&P 500 is up just 10.4%.
The part of our portfolio that has not done well in absolute terms has been our international portfolio run by Janus Henderson. The reason for this has been the strength of the dollar. But we wonder what will happen to the dollar if the Fed lowers interest rates. Historically currencies weaken when rates are lowered. We have seen reasonable returns from international this year, up 14.7 %.
Better or Worse not Good or Bad
One strategist we have followed closely over the years has been Liz Ann Sounders, Chief Investment Strategist at Charles Schwab. She has suggested we will see a recession in 2019. Now she may or may not be right in that position, but she has a concept that we have found very interesting. She suggests you look at whether economic activity is getting better or worse not whether it is good or bad. We think this is sage advice. We also think the near future for the economy is worse not better.