.png?width=2167&height=417&name=Greenrock-Logo%20(1).png "Greenrock-Logo")

Share this
by Kevin Malone on Sep 30, 2020
This is a Time of Worry
As we look back at Q2, we find our clients and our country in a state of anxiety. We have come through the period of being homebound and now face reopening. We all have some fear of COVID-19, some people more than others, but we see stories on reopening that look troublesome. So, the uncertainty of reopening in a COVID-19 world worries us.
We see a return of the S&P 500 in Q2 of 20% and our dividend strategy was up 18%. While we are all happy about the positive returns, we wonder if there is a disconnect between the stock market and the economy. Unemployment is still double digit, perhaps even higher than reported if you include the underemployed and the Gig economy folks. We know Q2 GDP will be negative and worse than the first quarter. This makes us wonder if the returns will continue, and this worries us.
We read about schools reopening in the fall but with mixed messages. For grammar school through high school, some districts have announced plans to fully reopen while others have plans for students to be in class half of the time. We wonder how this will work, especially those of us who have school aged children. Some colleges have announced campus populations will be 40% or 50% of normal, the remainder doing all distance learning. Even some that will have students on campus have announced all classes will be virtual. We wonder what happens if students test positive, and this worries us.
When we think of the day when this disease and its implications on our behavior will be a part of our history, we yearn for that time when we can be in crowds again without the possibility of getting COVID-19. For some of us that means going to plays, concerts and movies, while for others it means sporting events. All concerts, symphony and theater seasons have been cancelled. The Ivy League has cancelled all fall sports because they do not believe they can have them safely, and the Big Ten conference has cancelled all nonconference football games. For those looking forward to watching our favorite teams play sports this fall, this worries us.
The continuation of a handful of stocks leading the stock market is a question on the mind of all investors, even those investors who are participating. The FAAAM stocks, Facebook, Amazon, Apple, Google/Alphabet and Microsoft, now represent 20% of the S&P 500 and 31% of the Russell 1000 and are the largest stocks in both indices. If you add Netflix to that group, the combined six stocks are up 50% in the last 12 months while the S&P 500 is up 7.5%. This reminds us of 1998 and 1999 and it worries all of us. Chart 1 shows the return FAAAM stocks and Netflix for the 12 months ending 6/30/2020 as compared to the return of the S&P 500. It also shows the returns of the S&P 500 for 1998 and 1999 as compared to the dividend strategies developed by Jeremy Siegel.
Chart 1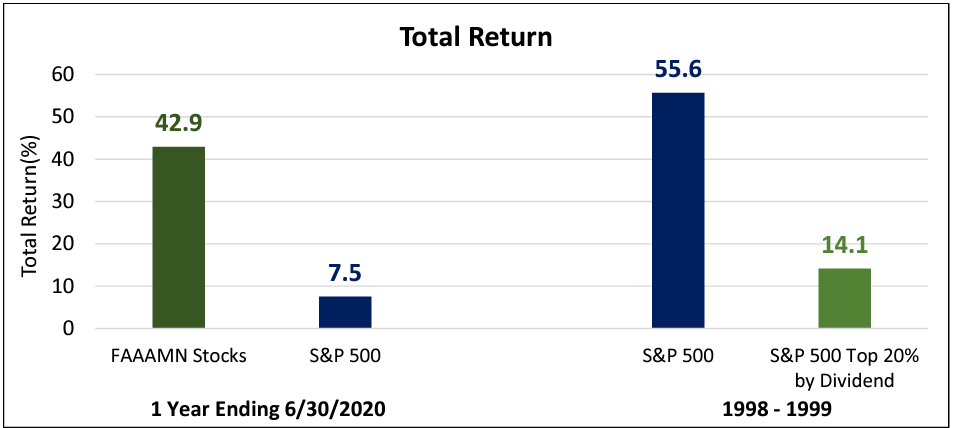 Source: Morningstar Direct, Jeremy Siegel's Future for Investors (2005) with Updates to 2009.
So, what do clients feel?
The quick answer is a lot of fear and not much hope.
Hersch Shefrin in his book Beyond Fear and Greed addressed the emotions investors experience in investing cycles. He corrected the historical way of thinking about those emotions, which was stated as fear and greed. He correctly pointed out that the real emotions are fear and hope. People are not greedy because they want to achieve their investment goals, they are hopeful. The investors who seek your counsel on their specific investment solutions hope they will reach their goals yet naturally fear what can happen when we experience times of uncertainty, like we are experiencing right now.
We have all seen clients extrapolate their most recent investment return experience. When returns are high for a period, many clients ask about increasing their equity exposure. Similarly, when we have downturns and troubling economic news, clients wonder if they have too much equity exposure. Peter Lynch showed that the returns he produced during his career for his funds were not the returns the average owners of the fund experienced. The average investor bought after good performance and sold after losses, so they achieved a return of less than half of the fund returns. Selling after poor performance or buying after good performance are two investment tenets everyone needs to avoid.
Today, growth is not only outperforming value, it provided more protection in the decline of late February and March which is very rare in history. When clients ask us to explain that reality, we can show them how the FAAAM stocks performed and point them to the late 1990s, showing them how that ended. But for the novice investor, they wonder why we did not see that coming. Chart 2 shows the returns of the S&P 500 for 20002002 as compared to the returns of our dividend strategy. We finished that period with up 15% while the S&P 500 lost 38%.
Chart 2  Sources: Morningstar Direct and Greenrock Research
We may have seen this movie before, but the clients have not!
It is easy for us to take comfort in the reality that our dividend portfolio has a high current yield, 4.4%, and is experiencing dividend growth above the level we would project. It tells us the fabulous performance of the FAAAM stocks and Netflix are imposters. It is also easy to look back to 1998 and 1999 when the S&P 500 rose 55% while Jeremy Siegel’s dividend strategy rose only 14% and say today’s experience looks remarkably similar. And we can say we have seen this movie before, even say it with certainty. But the clients do not see it. They worry that this time we may be wrong, maybe the stocks that are leading today will continue to lead for the current decade. Maybe this time it is different.
There were two stocks in the late 1990s that were the poster child for the excess valuations, Microsoft and Cisco Systems. Microsoft peaked at the end of 1999 and it took over 16 years to get back to that price, while Cisco peaked at 77 on the last trading day of March 2000. Cisco has never gotten back to 77, it trades at 44 today. Will the fate of the FAAAM stocks and Netflix mirror Microsoft and Cisco? Time will tell but the similarities on price, concentration in the index and contributions to the return of the index look awfully similar. There is a reason why Research Affiliates thinks the returns of the S&P 500 in the decade of the 2020s will be in the area of 1% annualized, and price of the FAAAM stocks and Netflix are why.
This is a time to hold our clients’ hands
During the winter of 2009 at the tail end of the Global Financial Crisis, my wife and I went to Mexico for a couple of weeks to get away from the Chicago winter. My plan was not to be gone from work, just to work from the house we rented in Punta Mita where it was about 80 degrees warmer. Our daughter joined us, and one afternoon as I was on a call with a client, my daughter asked my wife, as she was overhearing my conversation, if I was the client’s financial advisor or their shrink.
We have all experienced that. You may get paid to develop good financial plans and investment plans to help them achieve their goals, but you earn your keep by making sure they can sleep well at night. This is an acute time of helping clients sleep well at night. The worries everyone has that we have listed above is likely not complete, and everyone’s worries are specific.
Worry and fear are healthy emotions, they ensure we do not make decisions that conflict with our best interests. When we talk to a client, we may wonder why they are so fearful, why they are extrapolating the worst of this year into the remainder of their life. Likely the answer to this is they cannot articulate their exact fears, they know they are worried but do not know exactly what is worrying them. Our collective jobs are to help them determine their exact fears and chart a course that will allow them to sleep well at night.
We want to help!
We have spoken with some of your clients and are happy to speak to more. You can determine when this is appropriate, but you should know we are happy to help and ready to do whatever you would find helpful. The picture we see on the economy, on COVID-19 and on performance will change all for the better. Our job now is to help you get to that point.