.png?width=2167&height=417&name=Greenrock-Logo%20(1).png "Greenrock-Logo")

Share this
by Kevin Malone on Aug 23, 2023
Some History
When 1998 closed and we entered 1999, we did an analysis of how the S&P 500 achieved the return of 28% in 1998. We had the suspicion that the largest stocks contributed significantly to the total return. What we found was more dramatic than we expected, the top 11 stocks contributed more than the total return of the index. What this meant was that the S&P 11 was up 29% and the bottom S&P 489 was down 1% as weighted in the index. We had certainly seen periods of concentration, but not like this. So, when we wrote our Q1 1999 newsletter we talked about what had happened in 1998 and expressed the opinion that never again would we see a market where so few stocks provided more than the total return of the index. Were we ever wrong! In 1999 the top six stocks contributed more than the total return of the index, which was up 21%. In addition, over this two-year period those top six stocks, which were part of the top 11 in 1998, provided the total return of the S&P 500 index which was up 55% over the 2-year period. We had seen concentration before, but this redefined it.
This was a period of new technology stocks leading the market and seemingly leading the economy with tools that would improve the lives of businesses and individuals. The thought was that these new tools would change our lives for the better and they deserved very high valuations. What the market got right was the part about changing our lives but what the market got wrong was valuations. Change is hard and often slower than we would like. The leading stock over the 2-year period was Microsoft. Now Microsoft was then and is today a great company that is making our lives better, the problem was investors had driven the price too high. It took Microsoft 13 years and 9 months to get back to the high price it achieved in 1999. That is almost 14 years with no return. Now along the way Microsoft did start paying a dividend, so investors did get that income for some of the time. That said, this redefined a dry spell.
What happened after 1999? Exactly what you think would happen after two years of severe concentration, the stock market fell dramatically. The S&P 500 declined in 2000 by 9%, in 2001 by 12% and in 2002 by 22%. $1 invested in the S&P 500 index on the first day of 2000 was worth 58 cents at the end of 2002.
Welcome to 2023!
The same phenomenon exists today, albeit for a shorter period. For the first six months of 2023 the S&P 500 is up 16.9%. The contribution of the top seven stocks in the index to that return was 113%. While the S&P 500 was up 16.9% the contribution of these seven stocks was 19%. What this means is the S&P 493 was down 2.1%.
Chart 1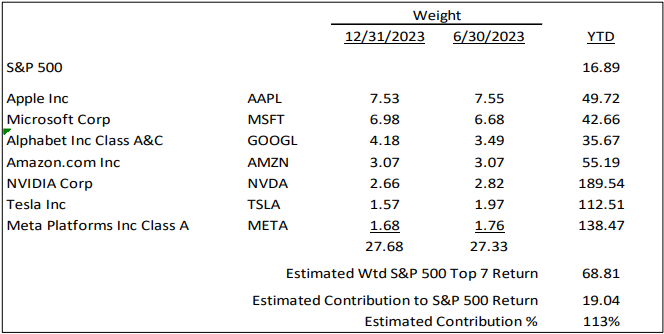
So, let’s see if we can make some sense of this.
NVIDIA is a stock of the Metaverse, which will certainly change our world for the better. The problem with technology changing ideas is the price of their stocks get way ahead of the impact of the technology. Today NVIDIA trades at 220 times earnings, which means it better change our world very quickly. The most likely outcome is the price of the stock has gotten ahead of the contributions it will make on society. History is full of these stories; Microsoft went over 13 years from its 1999 high before it hit a new high. Ark invests in companies they believe can achieve annualized return of 15% per year over the next five years, and Ark had owned NVIDIA for the entire time they have managed portfolios for us. They sold NVIDIA this year because they believe the stock price is too high to achieve that 15% annualized return. Good company? Absolutely! Problem is the price is just too high.
META is a company that had big designs on their new products, but it turned out the consumer did not rate them highly. They talked about investing in the Metaverse and invented products they thought the public would love. It turned out their product launch failed, they had to lay off workers and the stock fell precipitously from $379 in August of 2021 to $93 in October of 2022, just 14 months with a 75% decline. Meta trading at 93 was the same price it traded for in August of 2015, almost 8 years ago. Meta moved up to $148 by the end of last year, the same price it was in June of 2017. Now we are all familiar with the fact that 30% of the workforce at Meta was laid off and all hiring stopped. So, this was a nice bounce off the bottom but far from a price move based on great news.
Tesla is by anyone’s standards a volatile stock. It trades today at $261.77 (6/30/2023) which is up from its price of $123.18 at the start of the year but still far off its high of $409.97 on 11/4/2021. Now Tesla is a great company. The business most people know it for is the car business, but it is much more than that. You likely saw that Tesla is allowing Toyota and Ford to use its charging stations which are the largest group of chargers in the country. By allowing this, the Tesla charging system has become the standard for our country. This does not generate much revenue for Tesla today, but it will be a revenue source when charging an electric car comes at a cost everywhere, which it assuredly will. The third business of Tesla is a self-driving taxi business. The headlines today suggest that is a long way out into the future, but there are some developments which might suggest otherwise. Today Arizona is allowing self-driving taxis, not from Tesla but from Waymo. This started in 2022 when people could choose a driver or driverless taxi. Today Waymo has a fleet of driverless taxis in Arizona that are thriving. The people we follow suggest that there will be driverless cars nationally within two years. We will see if that is right, but it will come someday, and Tesla will have the largest driverless taxi fleet in our country. So, like Meta, the price movement of Tesla today is still down from its high of 410, today trading at 262 (6/30/2023).
Apple, Microsoft, Alphabet and Amazon are all great companies that are up between 36% and 46%. Yes, they are all great companies and yes, they are volatile but those returns are difficult to explain and would suggest caution not jumping on the bandwagon.
What Happens Now?
All of these companies will be around five years from now and likely all of their stock prices will be higher. The real question is will they be good investments. History suggests caution. The easy answer is the companies that will be higher are those whose who achieve high earnings growth but with reasonable price relative to that growth will be the winners. So, our view on all of these stocks is that NVIDIA is likely to have the best growth rate from here, but the question for them today is what price relative level will be used to value the company in 5 years. It is unlikely it will be 222 times earnings. Meta, Apple, Microsoft, Alphabet and Amazon will all be more mature companies 5 years from now, so their P/Es are likely to be lower. That said, any of them could add products or services that could change their direction. You may have seen that Tesla delivered 83% more cars in Q2 of this year than they did in the same quarter of last year. It is hard to believe we will see that same growth 3 or 4 years from now, so Tesla’s future is dependent on the timing of self-driving and the revenues from owning the charging network, not just selling cars. Perhaps the biggest future revenue source for Tesla will be self-driving taxis.
That is what we see for the small group of stocks moving the market today. What we see for our dividend portfolios is another story. Let’s start with a look at history. The chart below shows the performance of our dividend strategy and the S&P 500 during the decades of the 2000s and the 2010s.
Chart 2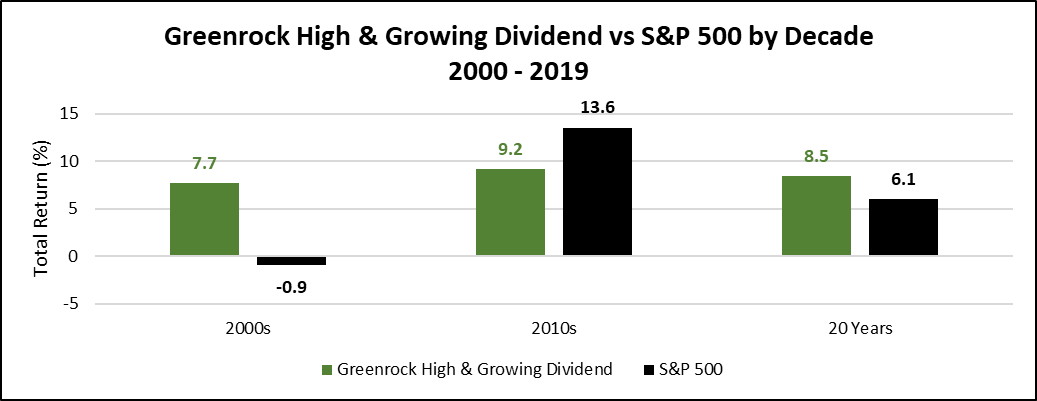
As you will see on a relative basis, we look like geniuses in the decade of the 2000s and completely incompetent in the decade of the 2010s. For the 20-year period, we compounded client assets at 8.5% while the S&P 500 compounded at 6.1%. So, long-term this confirms why we think the dividend strategy is the better solution for clients. We would also say that even in the decade of the 2000s our clients achieved the return needs of almost all of their clients, while the S&P 500 achieved the return needs of none of their clients.
So that is history, where are we today?
Conventional wisdom on the history of the stock market would tell you the longest bull market in history was 1982 to 1999. What people miss who express this opinion is that in 1987 the stock market fell over 25% before it rallied back to be up for the year. So, the actual longest bull market in history is from 2009 to 2021, 13 years. The annualized return of the S&P 500 index was 16%. The stock market ended 2022 down 18% but was down over 25% earlier in the year. During this bull market run our dividend strategy compounded at 10.9%. This is certainly lower than the index, but as we have said about other periods, all of the clients achieved their investment return needs during this period and had a strategy that would protect them when, not if, there was a stock market decline.
Perhaps the best indicator at any point in time for the future return of the stock market is price. When stocks are cheap, you can get great future returns, but when stocks are expensive future returns are low. The price to sales ratio is the best indicator of whether stock prices are cheap or expensive. Now it is true that most people like to use price to earnings ratios, but we believe earnings can be manipulated more easily than sales. We have 120 years of price to sales data, and we compared the price to sales ration at year end last year to the history we have. What this showed was that the price to sales ration of the S&P 500 as of 12/31/2022 was in the top 5% of price to sales ratios over this 120-year history, expensive by anyone’s standard. We wondered if perhaps our data was actually too long. Perhaps an odd thing to consider but remember 120 years ago was 1903 and a lot has changed since then. So, we took out the bottom half of price to sales data whenever it occurred. What this left us with was 60 years of price to sales data but spread out over 120 years. The result did not change, the price to sales ratio in this methodology was still in the top 5%.
On any measure, one does not want to be aggressively investing when we are in the top 5% category, regardless of how one calculates the top 5%. So, that is where we are, stocks are expensive. While this is clearly a time for caution, it is not a time for burying your head in the sand. Our dividend strategies will provide reasonable returns over the next decade just like they did in the 2000s even if the index is flat.
Let’s look at what has happened to date this year. These are the returns of our equity strategies against their respective indices.
Chart 3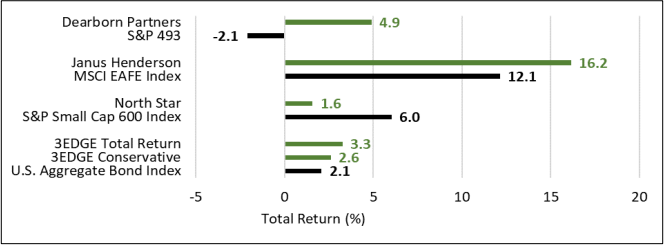
The summary of all of this shows we are having a good year with positive returns in all of our strategies except small cap. This was after last year when we preserved capital well in a declining market for both stocks and bonds.
Our thoughts on the stock market and the concentration are that it will change, it always does. Now the question using history is whether we are in a time like 1998 or 1999. While impossible to know, the index followers will at some point, this year or next, get their head handed to them just like they did in 2000-2002.
One Final Thought on Bonds
The yield on the 10-Year U.S. Treasury crossed a 4% yield on July 7. That yield is up from 3.23% at the beginning of April. By any standard this is a pretty dramatic move. The question is why it is moving in this direction. Bond yields rise for two reasons, either as an indicator of future inflation or because of high demand for borrowing. Many very smart investors think following the 10-Year is an important indicator for where stock prices are headed.
So, could this be an indicator that the economy is great and we are headed higher? Certainly possible, but we doubt it. We have seen any number of companies reducing staff in anticipation of a slowdown, and we think this is a much more likely outcome than a resurgence of growth. We think the more likely occurrence is that the bond market is telling us we are headed for trouble. This is not good for bond investors and ultimately not good for the equity markets.