.png?width=2167&height=417&name=Greenrock-Logo%20(1).png "Greenrock-Logo")

Share this
by Kevin Malone on Dec 30, 2018
THE DEATH OF 60/40 PORTFOLIO
Everyone wants principles to guide their lives, rules that will make our lives productive, meaningful and successful. Advisors who counsel individuals want investment principles that are sound, safe and have some historical perspective. They start with finding the right principles for asset allocation. Most use a historical perspective to set the right allocation between stocks and bonds for each client. You want enough equity exposure to give your clients reasonable return expectations, but not too much so that the volatility of equities does not overwhelm clients. Bonds are the counter balance; they may provide lower returns, but they also reduce volatility. So, let’s look at history and see if we can examine how Advisors made decisions and what the implications of the common asset allocation strategies will be on future returns.
THE LONG‐TERM
Asset allocation was the work of Harry Markowitz. In 1952, he published a study that became the standard for asset allocation, and he showed the best allocations on what he called the efficient frontier. He used two variables, stocks and bonds, and demonstrated how they had very low correlation and offered different characteristics to a total asset allocation. Stocks offered higher returns than bonds, but also came with higher volatility. Bonds had expected returns that were reasonable yet lower than stocks, but they also had much lower volatility. In a perfect world, bonds would be the anchor to windward when stocks declined. Sticking with one’s stock portfolio over the long run would provide higher returns. Interestingly, he came up with this theory by applying mathematics to the study of investment portfolios. When he received his PhD in Economics from the University of Chicago, Milton Friedman noted that his dissertation had nothing to do with economics but was crucial to the development of knowledge in investing and thus voted to award him the degree.
Dr. Markowitz talked about optimal portfolios which contained a precise mix of stocks and bonds in order to produce a desired level of volatility. One of his key assumptions was that risk or volatility was the ultimate measure of return. The more risk one took, the higher their future expected return would be. Conversely, investors who could not withstand risk could expect much lower returns. He drew the efficient frontier which outlined the return expectations one could expect based on the risk one was willing to absorb. Markowitz argued that all one needed to do was to calculate their acceptable level of risk and the efficient frontier would provide them with the perfect portfolio. There are some significant assumptions in Markowitz’s theory. The two that are important as we think about his theory today are normal distributions and rational behavior by investors.
NORMAL DISTRIBUTIONS AND RATIONAL BEHAVIOR
Distributions is the study of statistics to observe patterns. If one looked at the weather pattern in Chicago, it would be easy to suggest we are more likely to warmer weather in July than in January. The average temperature in January is 32 degrees while it is 84 degrees in July. If people dressed just based on the average temperature, they would certainly have surprises. These surprises are referred to as long tails in statistics. Long tails suggest that averages can be determined, but there will be ranges of normal. So, while 32 degrees is the average temperature in January, that does not mean 32 degrees will be the temperature every day. There will be a range around normal. The record high in January is 67 and the record low is July is 51. So, using normal distributions as your method of determining what you wear would leave you awfully cold on some days and well over dressed on other days. Markowitz was using these statistical principles to study investment portfolios. He based his work on normal distributions, and in reality, he had no other choice. He needed to study long‐term data and he needed to do so in such a way that he could advise people on portfolio allocations during normal times.
He also based his work on the premise that rational behavior would be how investors would react to market movements. The idea was that individuals would be thoughtful about their portfolios and understand that the stock market will experience years of negative returns. When investors experienced a negative return year, they would have perspective and understand this was normal. They would also understand that two negative years in a row were highly unusual, so reallocating to their stock portfolio would be the rational thing to do. Just like he had no choice but to study normal distributions, he had no choice but to believe that everyone would act rationally when stress points came.
The reality of investing is that normal distributions have exceptions and irrational fears arise out of times when markets decline. Markowitz knew this in 1952 when he developed his asset allocation theory. Today we are living in exceptional times and expecting a normal distribution of returns for the next decade will lead to disappointment.
WHAT IS NOT NORMAL TODAY?
The quick answer is bonds, but stocks have their issues as well. We will start with the bond market. The annualized return of the 10‐Year U.S. Treasury from 1910 to September 30, 2018 was 4.7%. We use the 10Year U.S. Treasury as our proxy because it has the longest history of bond proxies. We are aware that active bond management has achieved higher returns, so you can add whatever additional return you like to approximate the returns you might have received during this time frame. This is the data, obviously with a different time frame, that Markowitz was using to develop his allocations. His thesis was that bonds would provide reasonable returns and simultaneously they would provide volatility reduction.
So, if the long‐term returns of the 10‐Year have been 4.7%, can we expect that today? Charts 1 and 2 will give us some insights into the answer to that question. Chart 1 shows the yield of the 10 Year as of the beginning of each year and Chart 2 shows the total return of the 10‐Year for each decade.
Chart 1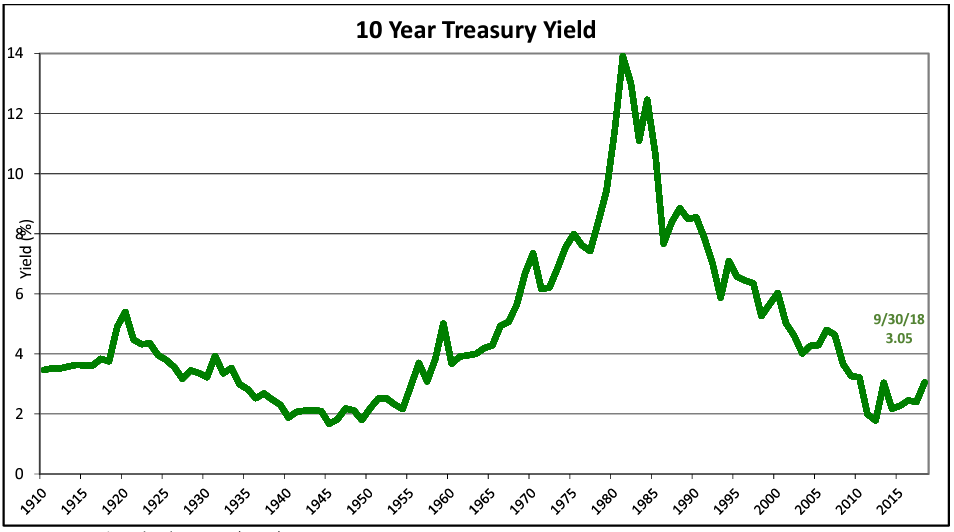 Source: St. Louis Federal Reserve (FRED)
Chart 2 shows the returns of the 10‐Year for each calendar decade.
Chart 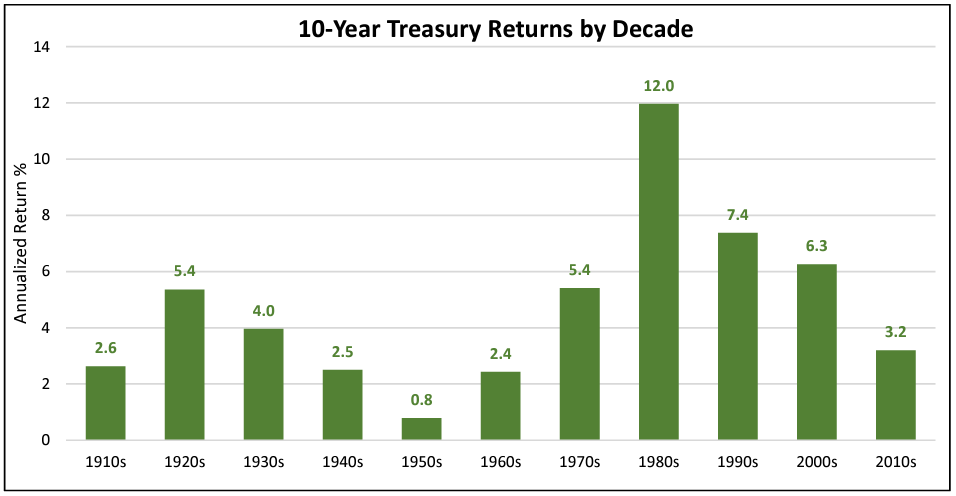 Source: St. Louis Federal Reserve (FRED), http://www.stern.nyu.edu/~adamodar/pc/datasets/histretSP.xls
You will note that when rates are declining, returns are terrific. The 1980s, 1990s and 2000s saw fabulous returns from bonds. But, when rates are rising like the 1940s, 1950s and 1960s, returns were negligible. The period of 1940‐1960 was like having a series of 67‐degree days in January in Chicago or 51‐degree days in July. Normal distributions in fixed income comes in decades not in days like weather patterns.
SO, WHAT ABOUT THE PRINCIPLE OF LONG‐TERM INVESTING?
Long‐term investing should not be oblivious to the current reality of price. This is true for any asset class, but especially true of fixed income because of the slow and long‐term changes in interest rates. Unlike our examples of normal distribution in weather patterns, equities and fixed income will be measured in much longer periods than the odd day in January of 67 degrees. Equities can go from over‐priced to fairly‐priced in one year; however, when interest rates are low it takes decades to correct. In addition, fixed income returns are a simple arithmetic problem. You calculate total return by determining the current yield and adding or subtracting the gain or loss based on whether rates fall or rise. A bull market started in bonds in the 1980s because rates were high and beginning to fall. Fixed income investors had both high coupons and declining interest rates, so returns were fabulous. The problem we have today is we have low coupons and rising interest rates.
So, it will be years or even decades before you can make the assumption of reasonable returns from bonds. They will reduce your volatility, but they will not allow you to achieve your clients’ investment return needs. The coupon is simply too low. You will need to reflect on the decades of the 1940s, 1950s and 1960s to understand the near‐term future of bond returns. During these decades the 10‐Year annualized at 1.9% for 30 years. You can add to that whatever excess you believe you can get above the 10‐Year by investing in corporate or mortgage fixed income securities. Even if you add 2%, which we believe is highly suspect, you will still only be at a projected return of 3.9%. That return is before fee.
TWO POSSIBLE OUTCOMES
There are two schools of thought on what will happen to interest rates as we look out the next five or ten years. Jeff Gundlach of DoubleLine Capital believes interest rates will rise quickly and precipitously. He believes the 10‐Year will be 6% in two years. He made this prediction two years ago and it has been widely criticized. Others believe there will be a much more moderate rise in rates. So, let’s look at fixed income returns if rates rise quickly or slowly.
If over the next two years, the 10‐Year went from 3.05% to 6% the loss would be 23.4%. This is the loss before earning any income. If the increase were linear monthly, which it almost certainly would not be, the income would be 9.2%. That would mean the total return for the 10‐Year over the next two years would be negative 14.2%.
If rates rise more slowly, the loss from 3.05% to 6% would be the same, but the income would be greater because it would cover a longer time frame. We will not speculate on what a slower rise might look like, and it is anyone’s guess as to what it might look like. You can do your own stress tests to determine that for yourself.
Both scenarios are concerning and will be really bad for investors. Couple this with the fact that from the beginning of 2013 the Barclays Aggregate Bond Index has compounded at 1.5% annually, we are experiencing an enormously difficult time for bonds.
PURPOSE OF BONDS IN ASSET ALLOCATION
There are four generally accepted roles for bonds in client portfolios. They are as follows:
- Diversify from equities
- Preserve capital
- Protect against inflation
- Produce income
We believe bonds do diversify portfolios away from equities. Bonds will provide a different and lower volatile portfolio.
We believe they do preserve capital, but not if rates rise; a negative 14.2% return from the 10‐Year feels like an equity return.
Bonds have not, over the last 5 years and 9 months, provided inflation protection with an annualized return of 1.5%. Whether rates rise slowly or quickly, they will not provide inflation protection in the future.
We believe bonds do provide income, just not at the level that can solve the income needs of your clients.
So, all of this leads us to suggest if you are using bonds, you need to lighten them in portfolios. Other than diversifying from equities, bonds fail their accepted roles in portfolios.
Now it needs to be stated that there is a third possible outcome, interest rates fall over the next few years. Theoretically, it is possible that the 10‐Year could go from 3.05% to 1.49%, which is the low on the 10‐Year during this cycle. While possible, there are signs that suggest this is highly unlikely. First, the Fed has targeted a 2% inflation rate going forward, and second, GDP growth this year will be 3%. So, when you factor in inflation and GDP growth, one would question if it is possible for rates to fall.
If we were surprised and rates did fall back to the 2016 low, this would be a signal of no growth and no inflation, perhaps even deflation. This would be very bad news for our stock market; it would signal a very large correction. Bonds would have positive returns, but coupons would again be below 2%. This would make conditions even worse for the future returns of bonds.
IF THE 60/40 IS DEAD, WHAT DO WE DO?
Well, we would start by saying not only is the 60/40 dead, the 40/60 is dead as well. Bonds cannot be used today as they were used when the 10 Year went from 15.75% to the 3.05%. During this time bonds were the perfect antidote to equities, but today they offer low coupons and the possibility of much higher volatility than their historical norms.
The attempt to solve this issue by adding High Yield to Investment Grade Fixed Income Portfolios has been a common way RIAs have solved for this problem, and it has worked. From 1/1/2013 to 9/30/2018 The Barclays Aggregate Bond Index compounded at 1.5% when High Yield compounded at 5.5%. So, it worked. You got higher yields coupled with tighter spreads, and everyone was happy. This cannot continue! High Yield is playing with Fire! Yields are too low and spreads are too tight. Over the last decade corporate bonds issuance has skyrocketed. BBB rated bonds totaled $700 Billion in 2008 and total $3 Trillion today, more than a four‐fold increase. High Yield has seen similar growth. Just imagine what will happen to both of these types of bonds when we have a recession.
The answer to what to do is to start by at least cutting your allocation to fixed income in half. You should introduce Liquid Alternatives to client portfolios, and we would be happy to discuss how. For purposes of this paper, we just want to point out the pitfalls of bond investing.