.png?width=2167&height=417&name=Greenrock-Logo%20(1).png "Greenrock-Logo")

Share this
by Kevin Malone on Dec 31, 2019
What do you do when both stocks and bonds are overpriced?
Last quarter, we wrote about the dramatic rise of both the stock and bond market in the first six months of this year. The Barclay Aggregate Bond Index was up 6.0% and the Standard and Poor's 500 index was up 18.5%. We stated that they were giving us opposite signals. The stock market was telling us that our economy is doing well, that GDP was likely to rise not fall and the future looked bright. The bond market was signaling something quite different. The 10-year US Treasury yield fell from 2.66% at the beginning of the year to 2.02% on June 30th. This was signaling a slowdown, suggesting that GDP would decline as we look out to the future.
We suggested we listen to the bond market and not the stock market. The data from the third quarter has confirmed our suggestion. During this quarter, the 10-year US Treasury fell from 2.00% to 1.60% and was up 2.27% while the S&P 500 rose 1.7%.
Chart 1 shows the yield of the 10-year US Treasury since 1910.
Chart 1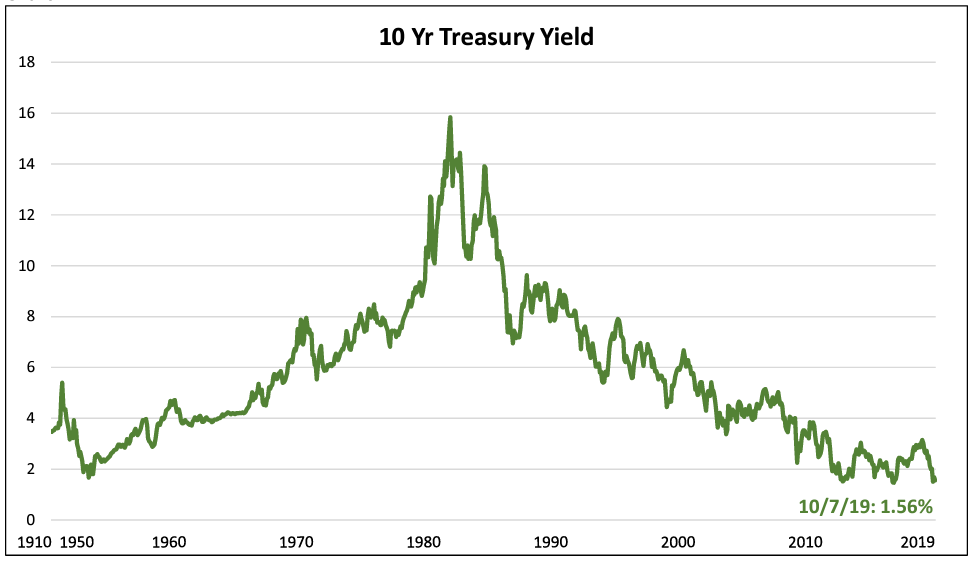 Source: St. Louis Fed (FRED)
Future Returns - Bonds
Everyone knows rates are low, and all students of investing know that future returns when rates are low do not solve the investment return needs investors require. Now it is true that one can expect a higher return than the yield on the 10-year, but our question is how much higher? There is actually a simple answer to this question: calculate the yield to maturity of your clients’ bond portfolios. If you use only investment grade bonds, you will see yield to maturity levels at slightly less than 3%. Can your clients achieve their investment return needs with expected returns at less than 3%? We would suggest you have very few if any clients who can answer this question with a yes.
This is actually the biggest issue the RIA community has, and we believe will ever face. Reflect on how one used bonds historically as clients went from the accumulation phase of their lives to the distribution phase, you shifted their portfolios from an emphasis of stocks to an emphasis of bonds. By doing this, you accomplished two things, you increased their income and reduced their volatility. Today you do reduce their volatility, which is a good thing; but you do not increase their income. In fact, you put clients in a position of knowing they will at some point need to take principle to pay their bills if less than 3% returns do not meet their investment return needs.
So, you need to think of bonds as a broken asset class. You cannot have the same relationship with bonds you had historically. You need liquid alternative managers like 3EDGE and Forefront. We have been using these managers for 19 ¾ years and have achieved a 6.65% annual return while the Barclays Aggregate Bond Index return was 5.03%. The volatility in these portfolios is higher than bonds, so you need to reduce equities slightly in order to keep the integrity of the volatility of the total portfolio intact. You need them because you cannot be as dependent on bonds in the way you have historically.
Future Returns – Stocks
The last ten years have been easy, you just bought the S&P 500 and ignored international stocks and emerging markets. If this was your investment thesis, you did fine. In fact, you outperformed almost all active managers in any asset class.
Likely though you did not pile into the S&P 500 ten years ago. While we did not know it then, we were just six months into a 10-year stock market recovery period. We were six months into the recovery from the 20072009 decline in stock prices that saw the S&P 500 fall 51% from peak to trough. 10 years ago, when stock prices were very cheap, we were scared. We were living in a time when Lehman Brothers and Bear Stearns had failed, when housing prices plummeted, when the government needed to prop up the banks, and when the price of Citigroup fell to less than $1.00. Ten years ago was a very scary time.
Yet had you looked past the economic turmoil of 2009, you would have achieved an annual return of 13.34% over the last ten years, an astonishing return, well over the long-term average of 10%.
Ten years after any tragedy, stock market declines or any personal tragedy, we have likely recovered from the emotions of that tragedy. So many people look back and say it was easy. All we had to do was to invest in the S&P 500 and we would have achieved remarkable returns. If this is the reflection you have, you have certainly forgotten the trauma you felt ten years ago.
There is a type of investor however who went through the period from November 2007 through February 2009 where the S&P 500 lost 51% and found comfort in the valuation levels of stocks. In 2009, P/Es got low and some investors saw the possibility of future high returns because stocks had fallen so much. History has shown us that if we buy stocks when prices are low, we get very high returns. Buying the bottom in 1941, 1949, 1982, 2002, and 2009 were very profitable times to invest.
So, let's look at what that group of investors are seeing today. Chart 2 shows the stock prices relative to earnings since 1927.
Chart 2  Sources: Bloomberg, Standard & Poor’s, 3EDGE. Overvaluation series generated by comparing 3EDGE’s model of current P/E ratios adjusted for normalized profit margins to fair value P/E calculations that incorporate both current and long-run cost of capital and implied growth rates. Data through September 30, 2019.
Today, stock prices are high, almost as high as they were before the crash in 1929 and in 1999. Investing in indices at these times costs investors 80% of their assets after 1929 and 37% of their assets in the 2000 to 2002 period. Buying the index today is very dangerous.
Every extreme period has a group of stocks that represent their peak. The FAANG stocks were the poster child of the last 10 years, and they peaked in 2018. The results of investing in them for the six years of 2013 to 2018 were staggering. During this six-year period, S&P 500 value compounded at 10%, S&P 500 growth at 14% and the FAANG stocks at 36%. That is not a misprint, 36%.
The longer this recovery went on, the more the narrative became about growth was the place for the smart investor. Passive was a better idea because active managers no longer understood the markets, and future GDP growth would be phenomenal.
Today that story looks tenuous at best. Future GDP growth looks to be in the 1% to 2% area, and the FAANG stocks have seen their bloom come off the rose. Do you recall when Apple and then Amazon had market values over $1 trillion? They have backed off since then.
The third quarter of this year saw value outperform growth 2.8% to 0.7%. This shift away from growth toward value looks similar to the shift that took place in 2000 to 2002. This was after the tech rise of the late 1990s. From 2000-2002 growth declined 37% while our dividend strategies saw positive returns of 15%. In other words, if you had invested $1 million in the S&P 500 on 1/1/2000 your portfolio would have been worth $630,000 on 12/31/2002. The dividend portfolio would have been worth $1,150,000.
Our dividend strategies shine when there is a shift from growth to value. Will stocks decline in the future as much as they did in the 2000 to 2002? Perhaps not, but growth investing and passive investing will be the wrong place to be.
What about a recession?
We think this is the wrong question. We may have a recession, we certainly have the catalyst for one with trade wars with China and Europe. We think the better question is future GDP growth. GDP growth in this country was 3.1% from 1946 to 1999. The factors that drove that growth were demographics, the baby boomers, the advent of China as a consumer and the advances of technology. GDP growth from 2000 to 2019 has been 2.0%. The change comes from the aging of the baby boomers and the slowdown of China.
So, we see a continuation of that slowdown, with GDP likely lower than 2% as we look out five years. Europe has slowed, Japan has slowed, China is slowing, and the US will slow as well.
We think rather than asking when a recession might start, ask this question: if we have one year of -0.5% GDP growth or +0.5% growth, how different would we feel? The first would be a recession and the second would not be a recession, but both would be painful.
The ninth group of baby boomers reached 65 this year and there are ten more groups to come. Technology continues to improve our lives, a good thing, but is also a cause of deflation. Lousy demographics and low inflation are a combination that suggests low future GDP growth.
This all sounds so pessimistic! Why are you optimistic?
Well we are pessimistic for those folks who are invested in the 60/40 passive portfolio. Over the next seven years, we think they will see portfolio returns in the area of 3% annually. We are also pessimistic about future returns from bond portfolios.
We are very optimistic about our strategies. We think our alternative managers will dramatically outperform fixed income; our dividend strategies will achieve returns of 7% to 8%. Over the next 7 years our current high and growing dividend portfolio will achieve a 5% compounded annualized return just from the cash flow if dividends rise by just 0.25% per year, considerably lower growth than we have achieved historically. In addition, and for those who use private investments like Landmark, they could achieve double digit returns. So, we feel very optimistic about providing future returns that will meet the investment return needs of your clients.