.png?width=2167&height=417&name=Greenrock-Logo%20(1).png "Greenrock-Logo")

Share this
by Kevin Malone on Dec 31, 2020
Resilience
definition: the ability to be happy, successful, etc. again after something difficult or bad has happened;
: the quality of being able to return quickly to a previous good condition after problems
This is a quality we need every day. We need to respond to little things that can negatively impact us in our daily lives, and occasionally we need it to respond to big things. If we are successful, we are resilient.
The same is true for markets. When economic conditions change for the worse, markets decline and investor psychology changes along with it. We are fascinated by studies that show investors are more positive about their investment portfolios and expect higher returns after markets have risen, and conversely, they are more negative and expect lower returns after a market decline. While this would suggest buying stocks at lower prices is devoid from investor psychology, the studies also show investors recover after markets start to rise again. Investors are resilient.
One could make the argument that resilience has never been more important in any year than it is in this year. We have just completed three quarters of the year, and the S&P 500 has risen 3.4% this year. Sounds kind of boring, like not much has happened! Well that would be the most off base conclusion one could make. 2020 has been the most remarkable year in almost all our lives. It is easier to list the issues in our lives that have not changed than the list of those that have changed. Masks, Purell and social distancing have become part of our daily routines. Gone from our routines are dinners out, parties, movies and socializing in general. It is an election year and normally that would be the biggest story of the year. While it has been for brief periods, we have reverted to the issues related to Covid-19 at every turn. Today we face the reality that our President and the First Lady have tested positive. All of us at Greenrock have the President, the First Lady and everyone who has tested positive, died or have had a loved one die in our thoughts and prayers.
We all would like to go back to normal, even dull sounds interesting today. But we are resilient, so we go on.
Volatility and the Stock Market
The volatility of the stock market has been record breaking. To demonstrate this, we have three charts below that show three distinct periods over the last 21 years. Can you identify the periods?
Chart 1 Chart 2
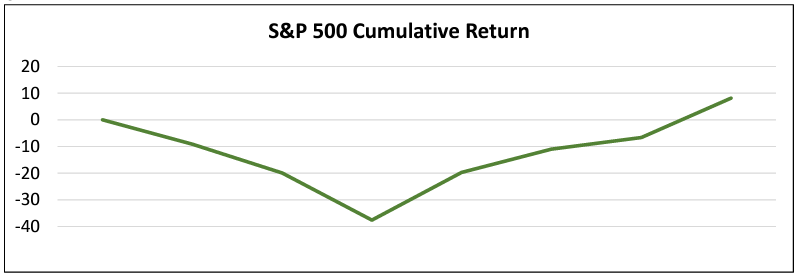 Chart 3
They all look somewhat similar, and honestly this is not a fair question. We picked these periods because they were similar, and it is nearly impossible to identify periods from a blank chart. Our minds are not built that way, we do not remember periods by a chart. That said, what we find interesting about these three charts is that they look somewhat similar. Charts 1 and 2 have slightly deeper declines than chart 3, but other than that observation they look reasonably similar. One of these charts covers a 6-year period while another covers 7 years, and one of these charts covers three quarters. So here are the charts with their periods identified.
Chart 1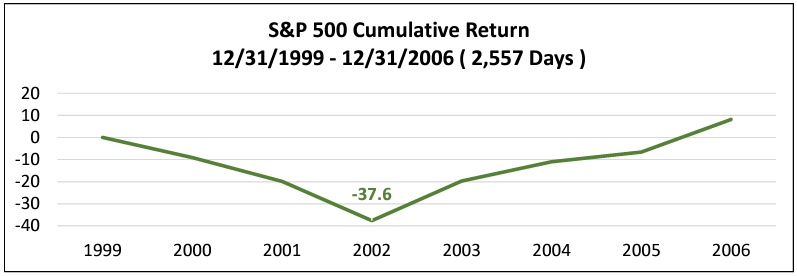
Chart 2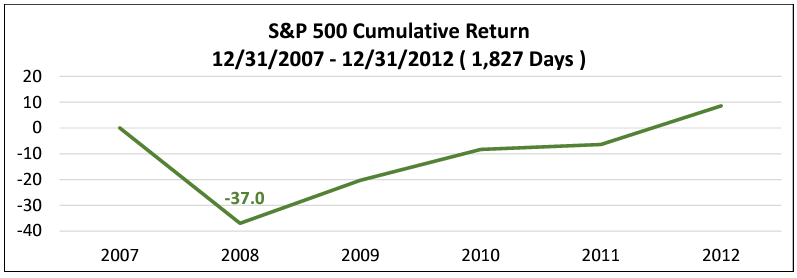
Chart 3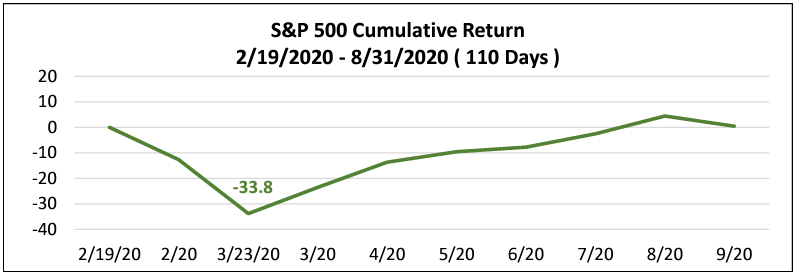
So, what took one to three years in two of the biggest declines in our history, took a little more than one month this year. All the periods saw a rise after the decline. Now it is important to note that what has happened this year is not the equivalent of a typical 6 or 7 year period. If we showed you other, in fact most, 6 or 7 year periods, you would not see 38% or 34% declines. You would see some volatility, but not dramatic declines. Since 1970, the last 50 years, there have been four periods when the S&P 500 declined more than 33%. We have shown three of those periods above, and the other was 1973-1974. That is the full list, 50 years.
Why is this Important?
When you couple the velocity of change in the equity market with all the other changes in our lives, you get a year that is making your head spin. We have internal mechanisms that allow us to adapt, resiliency. But perspective is also important. The definition of perspective that we believe is important today is this, to think about a situation or a problem in a wise or reasonable way. The perspective that we think is important to realize that the stock market reaction to the events of this year are not normal. We are being asked to be resilient and put in perspective changes at a rate we normally see over a decade or more, not 9 months.
Where do we go from here?
Welcome to the unanswerable, but we have some clues. We think three things happen as we end 2020 and move to 2021.
- Volatility remains. Our economy has been damaged by the shutdown and GDP will be negative this year. Recovery will not be linear, meaning not all sectors will come back together. Unemployment will take time to recover, so stimulus packages will remain an issue even into 2021. All of this suggests volatility will be with us over the next five quarters. We do not expect another decline like we saw in March, but we expect more volatility than normal.
- The election matters less than we think. We all feel very strongly about our candidate and about the issues our country will face if that candidate is not elected. The reality is we will see increased debt added over the next four years, an infrastructure bill passed putting people to work and improving our highways and bridges, and a slow but steady economic recovery and reduction in unemployment regardless of which candidate wins the election.
- Low returns from stocks and bonds will be our future. We know the returns from bonds given the current interest rate levels will be very low. We will not be able to achieve client investment return needs using bonds as we have in the past. The domestic stock market is bifurcated, but in a different way than it has been. Growth has outperformed value over the last decade, and we think value will outperform in this decade. But there will be tech stocks that bring change and will do well.