.png?width=2167&height=417&name=Greenrock-Logo%20(1).png "Greenrock-Logo")

Share this
by Kevin Malone on Dec 31, 2021
The S&P 500 is up 15.9% through September for the year. By any standard, we are having a great year and perhaps the market is suggesting more to come. The bond market, however, is suggesting a different story. The yield on the 10 Year U.S. Treasury is 1.55% as of this writing. The bond market is telling us the next ten years will see slow growth and low returns. So, which is it? Are we headed for higher returns and a bright future like the stock market is suggesting? Or should we take to heart the low yields of the bond market as a guide to our future? Let’s examine the data.
The Stock Market
“Predictions are very hard, especially about the future.”
This quote has been credited over the years to many people including Yogi Bera. While Yogi did a number of great things in his lifetime, especially if you were a Yankee fan, he did not invent the quote. What is surprising to me is that he said it, you see I never thought of Yogi as a guy who read too many books. Growing up a Brooklyn Dodger fan also made me skeptical of anything Yogi did well, but who knows, I could be wrong. This quote is actually from Neils Bohr, a Nobel Laureate Physicist who worked on the atom bomb.
While predicting the future is hard, we are all in the business of investing for our clients, and the future is what we have in mind when we invest. So, we ask ourselves constantly what will the markets provide for us over the next 1 year, 5 years, etc. Our margin of accuracy is always wide. If you are looking for accuracy in life, the investment business will not treat you well.
The most accurate method historically to predict future returns from stocks is a measure of the price relative today. You can use earnings, sales, or any measure you think historically gives you the best view. The idea is that if you are paying a high price for stocks, future returns will not be stellar. If, however, you are paying a low price for stocks, the future will be very rewarding. So, let’s look at some data. The following is from Steve Blumenthal at CMG. Steve writes a weekly newsletter that we never miss, is a friend and a very thoughtful investor. If you do not read Steve regularly, we would recommend you do. You can subscribe to his weekly newsletter here: https://www.cmgwealth.com/cmg-gets-social/
Chart 1 -Price/Earnings 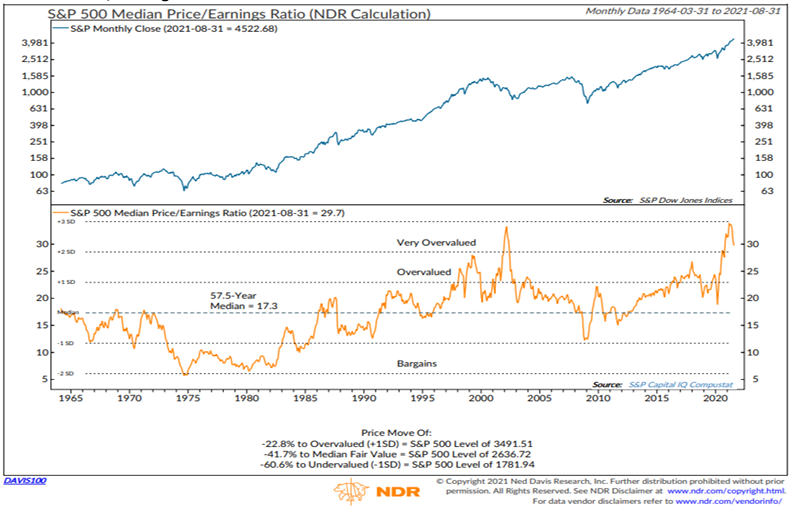
Chart 2 – Price/Sales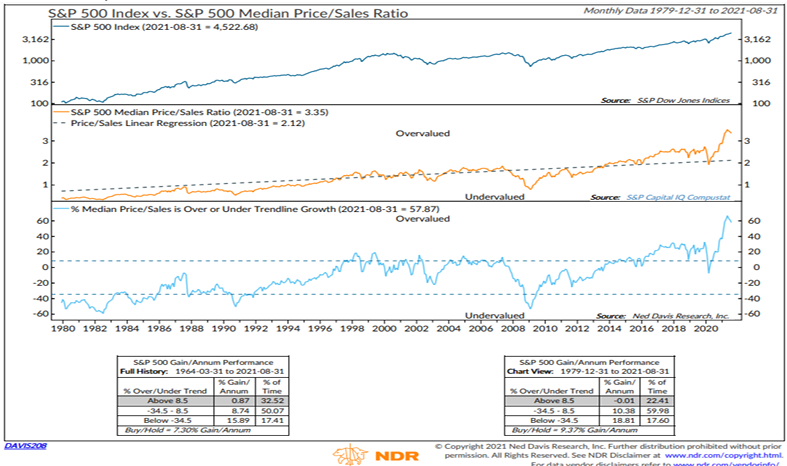
Chart 3 – Dividend Yield 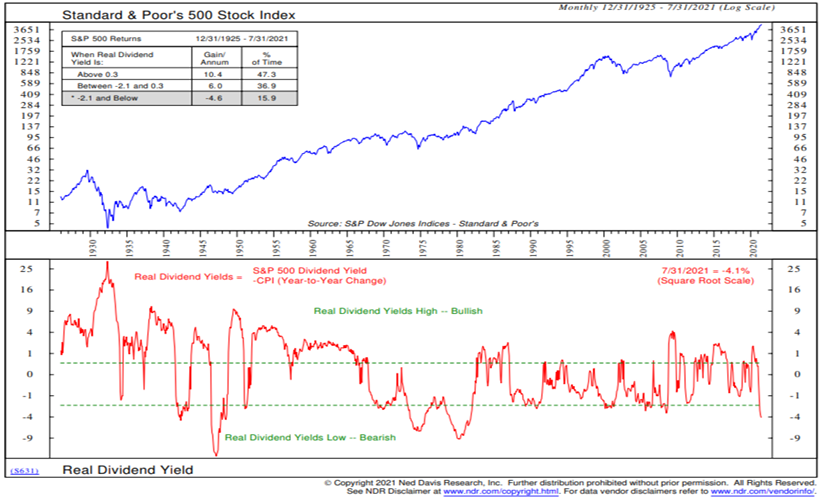
Chart 4 - Buffet Indicator 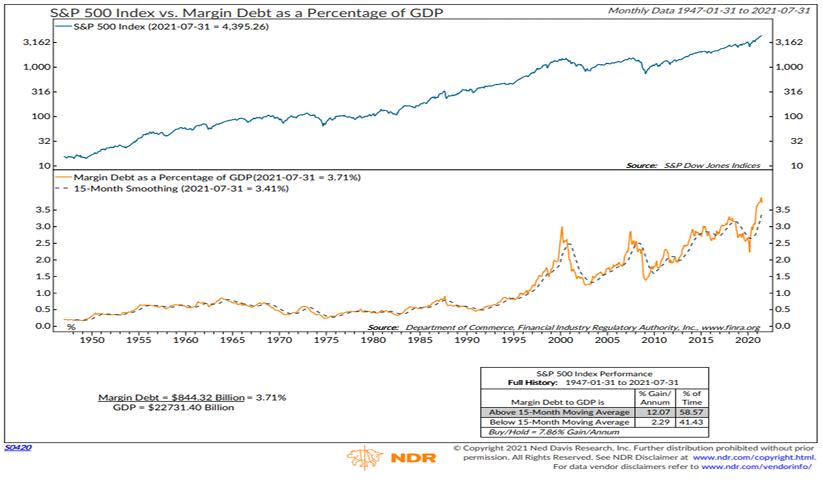
All of these indicators are suggesting the price of stocks is very high. Now just high prices alone are not historically a measure of near-term future returns that are low. It may be that stock prices are high because future earnings will be stellar, and investors will be rewarded. There are plenty of historical times when investors worried about a high level of stock prices only to see earnings do well and P/E’s decline. At the end of 1997, we were cautious, yet the future returns achieved by investing on the S&P 500 were spectacular. In 1998, the S&P 500 was up 28.6% and in 1999 up 21.0%.
Today you can find analysts who are suggesting a return to those times, but we have our doubts. The Fed has kept rates low and has been hoping for GDP growth of over 2%, perhaps even 3%. But growth has been hard to find. The Fed has wanted higher growth and higher inflation than we have seen. Their hope is that we can inflate our way out of some of the debt we have, but we have not seen it. Now we will see higher GDP growth in Q4 this year and Q1 next year. We may see higher growth in Q2 next year as well, but all of that growth is a make up for the growth we did not see last year when the Fed took rates to zero. We think we will see some what we call “make up growth” but not “follow through growth”. We are seeing some inflationary indicators right now as wages are rising and as are some goods that we need which are in short supply. But the real question on future growth relates to follow through. Will Q4 and Q1 growth lead to a continuation of that growth? Will the inflation we may see cause people to spend fearing more inflation? If the answer to these questions turns out to be positive, then perhaps we will see a rise in GDP growth. We think the follow through will be low and not have a dramatic impact on GDP. We think we will find ourselves back in the slightly sub 2% GDP growth as we get into the second half of next year.
If we are right, what does that mean for the stock market? It means we will have a correction, perhaps a severe correction. Stocks today are priced for perfection, priced as though we will not only see high GDP growth next year but a follow through after next year. We have our doubts.
If we are wrong, what does that mean for the stock market? It means things will be better, but stock prices are really high. The history of investing at new highs is not good. Certainly, there have been times when investing at high levels leads to good returns, but not for long periods of time.
Given all of this concern, let’s look at what others are saying.
Rob Arnott of Research Affiliates publishes daily expected returns over the next ten years of many asset classes. The chart below shows some of the asset classes we follow.
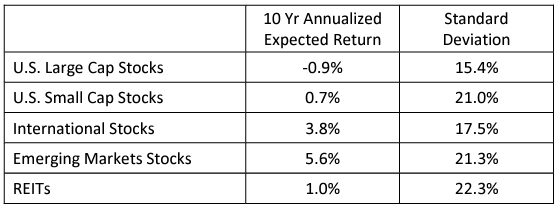
We could show you other’s predictions which make these numbers look promising. Firms like Hussman Strategic Advisors, manager of the Hussman funds, are predicting much more bearish numbers. They think the annualized return of stocks over the next decade will be negative 6% per year. Now we will see in ten years who is right, but our collective job today is to protect client assets from declines while achieving reasonable returns when the opportunities present themselves. We have great respect for the work of Research Affiliates, and while we do not take their predictions as literal, we do heed their warning.
Do you recall 2000-2002?
If not, we would suggest studying that period. We are not suggesting a repeat of that period, but we are suggesting the level of stock prices should have our attention. Stock prices today have what we assume is the guarantee of the protection of the Fed priced into them. While we understand why this is, we think it is a very risky assumption. Yes, it is true that the last two years of returns have benefitted from the Fed “protection”. What we also know is this will not go on forever. Are we suggesting it will end this year or next? We have no idea, but it does remind us of 1998 and 1999. This was the height of the Dot.Com period when companies did not have to have earnings. That turned out to be horrible advice with substantial losses on speculative companies. We think this time will result in the same.
So, how do we invest?
In a word, carefully! Let’s look at our ideas and review the principles.
Fixed Income
The yield on the 10-Year U.S. Treasury as of the end of Q3, 2021 is 1.55%. This sends us two messages. Bonds are a broken asset class with yields too low to solve almost anyone’s investment return needs, and future returns will be abysmal. Research Affiliates is suggesting the total return of the Aggregate Bond Index will be negative 0.7% per year for the next ten years. In other works, you will have less in actual dollars ten years from now than you do today! While the number may not be exact, we do think the principle is correct. We have never, not even during the Depression, seen interest rates this low. Bonds are definitely a broken asset class.
Equities
Stocks generally are overpriced. The history of the stock market tells us clearly that returns are not linear. Prices get dramatically undervalued and then dramatically overvalued. Today stocks are priced for perfection, like they were in 1998 or 1999. Now it is true index investing has been very rewarding over the last ten years, far outstripping the returns of active managers. One publication we saw recently suggested that the index beat 80% of active managers over the last decade. This has happened in the past, the problem is that it is followed by horrible relative returns for the index. Now we do not know if this is the top of the market. From our perspective it should be, any further expansion of P/Es looks to us as completely unwarranted and crazy. That said, it easily could continue. We think this is a time of caution and conservative equity investing. Our dividend strategies have shined in periods like this historically, and we think they will this time as well.
Alternative Investment Portfolios
The history of our 3EDGE portfolios has been very positive in periods like we see today. You just have to go back to last year when stock prices declined to see what kind of protection you can get in downturns and what kind of total returns you can get in full periods. These need to be a large part of all client portfolios.
Specialty Investments
All of your clients should have some investment in the Red Dot 2-year portfolio. It pays 6% and while it has some theoretical possibility of loss, we think the structure argues for taking the risk. We are happy to discuss with all of you why we believe this. The minimum is $10,000 so it available to everyone. We also have some longer-term high cash flow opportunities. While these are not appropriate for all clients, they are potentially high return investments.
Caution
While we continue to look for other safe and likely illiquid investments, we have nothing to report today. These are the tough times when expected returns are low and we are not flush with good ideas. If we can help with conversations with clients, we are happy to do so.